1.figure�������
(1)figure�˵��
- figure(num=None, figsize=None, dpi=None, facecolor=None, edgecolor=None, frameon=True)
- num:ͼ���Ż����ƣ�����Ϊ��� ���ַ���Ϊ����
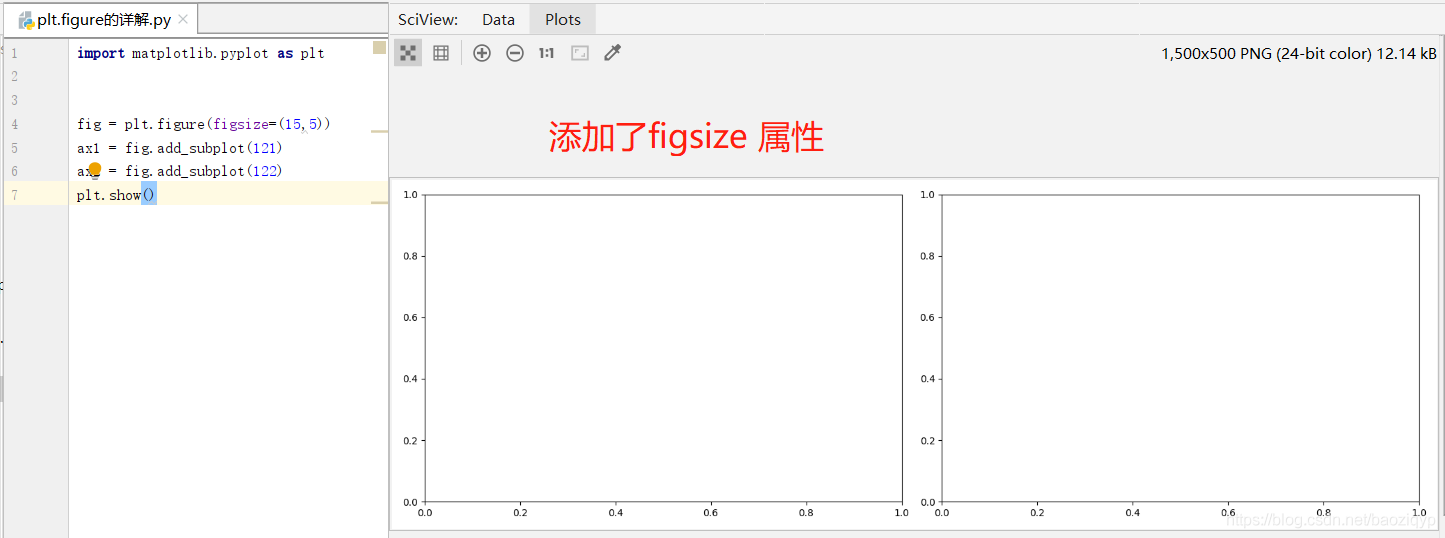
- figsize:ָ��figure�Ŀ��ߣ���λΪӢ�磻
- dpi����ָ����ͼ����ķֱ��ʣ���ÿӢ����ٸ����أ�ȱʡֵΪ80 1Ӣ�����2.5cm,A4ֽ�� 21*30cm��ֽ��
- facecolor:������ɫ
- edgecolor:�߿���ɫ
- frameon:�Ƿ���ʾ�߿�
(2)����:
import matplotlib.pyplot as plt
�����Զ���ͼ��
fig=plt.figure(figsize=(4,3),facecolor=��blue')
plt.show()
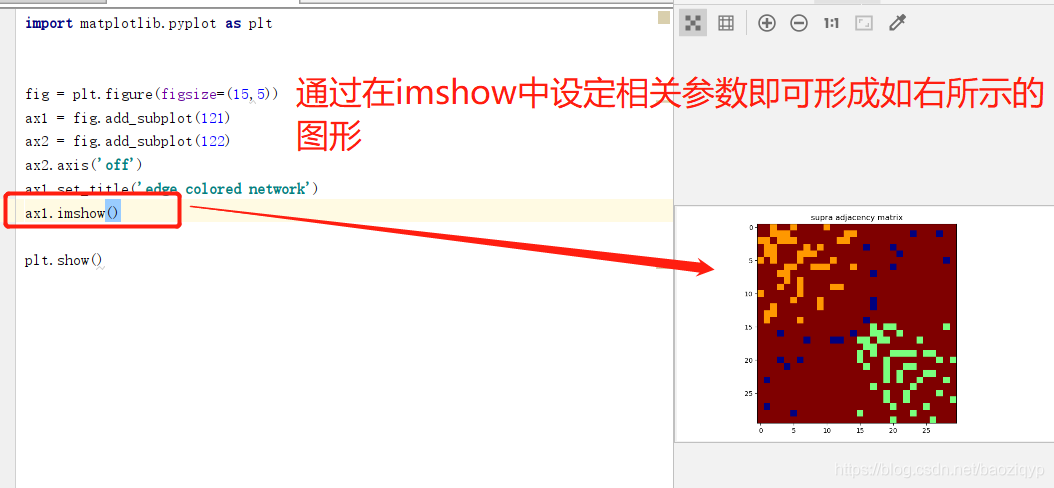
2.subplot����������ͼ
(1) subplot�
subplot(nrows,ncols,sharex,sharey,subplot_kw,**fig_kw)

�������м���ʾ
plt.figure(figsize=(a,b))��plt.subplot()��������
plt.figure(figsize=(6,8))
��ʾfigure �Ĵ�СΪ����������λΪinch��
figsize : (float, float), optional, default: None
width, height in inches. If not provided, defaults to
rcParams[��figure.figsize��] = [6.4, 4.8].
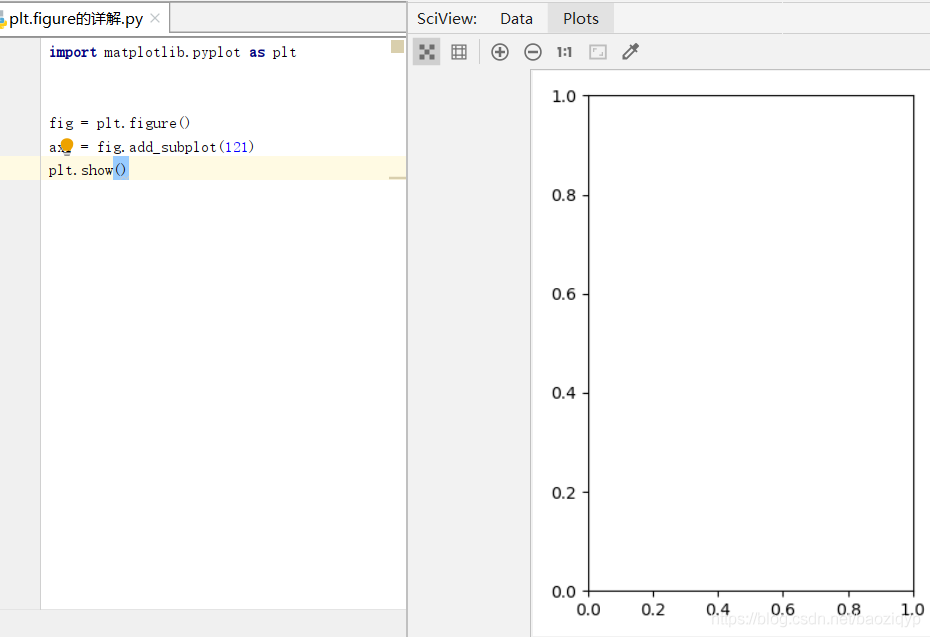
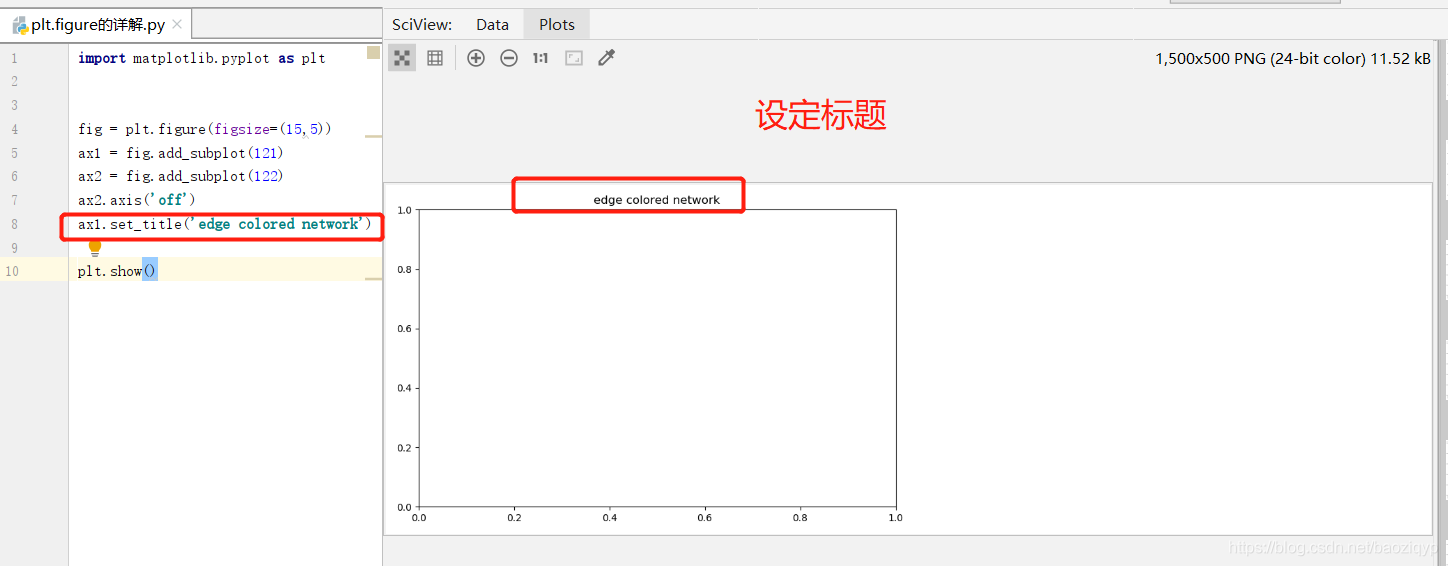
plt.subplot(121)
��ʾ����figure�ֳ�1��2�У���2����ͼ��������ͼ�ڵ�һ�е�һ��
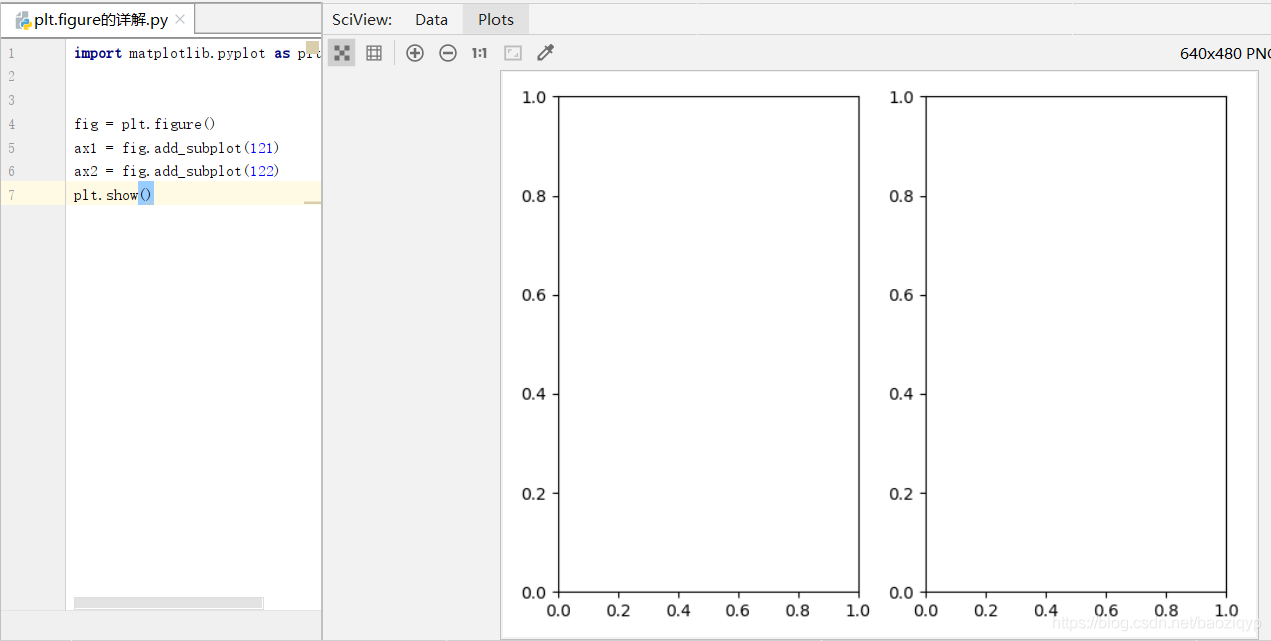
plt.subplot(122)
��ʾ��ͼ�ڵ�һ�еڶ���

������ƪ����plt.figure()����ʹ����⼰������ʾ�����¾ͽ��ܵ�����,�������plt.figure()��������������վ��������ǰ�����»�������������������ϣ������Ժ���֧��վ�����ͣ�
js