Citycode = { "֣��": "101180101",
"����": "101180301",
"����": "101180401",
"ƽ��ɽ": "101180501",
"����": "101180601",
"����": "101180701",
"����": "101180801",
"����": "101180901",
"����": "101181001",
"����": "101181101",
"�ױ�": "101181201",
"���": "101181301",
"�ܿ�": "101181401",
"���": "101181501",
"פ����": "101181601",
"����Ͽ": "101181701",
"��Դ": "101181801",
"����": "101180201"}
citycode_lists = list(Citycode.items())
for city_code in citycode_lists:
city_code = list(city_code)
print(city_code)
citycode = city_code[1]
cityname = city_code[0]
url1 = 'http://www.weather.com.cn/weather/'+citycode+ '.shtml'
html1 = getHTMLtext(url1)
data1, data1_7 = get_content(html1,cityname)
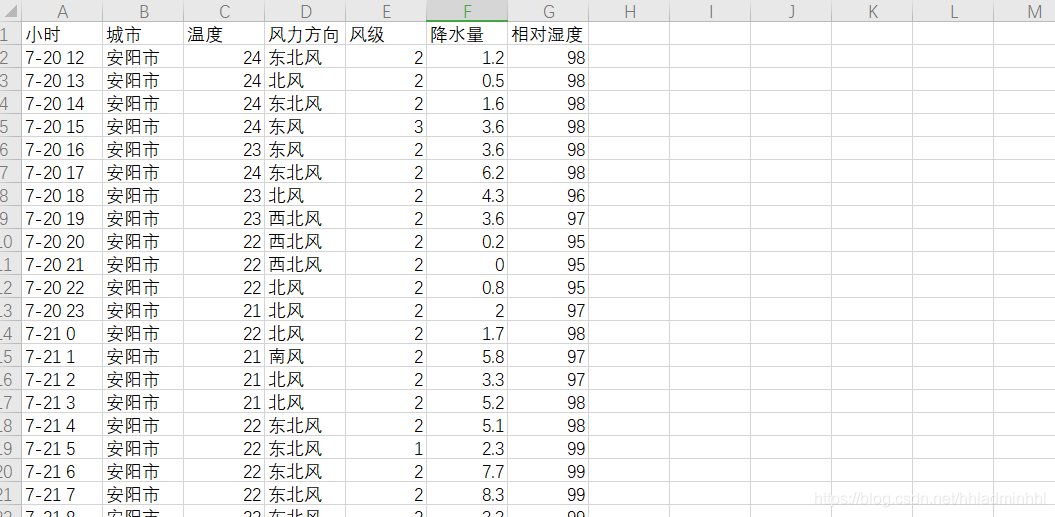
�洢����:
def write_to_csv(file_name, data, day=14):
"""����Ϊcsv�ļ�"""
with open(file_name, 'a', errors='ignore', newline='') as f:
if day == 14:
header = ['����','����','����','�������','�������','����1','����2','�缶']
else:
header = ['Сʱ','����','�¶�','��������','�缶','��ˮ��','���ʪ��','��������']
f_csv = csv.writer(f)
f_csv.writerow(header)
f_csv.writerows(data)
write_to_csv('��������.csv',data_all,1)
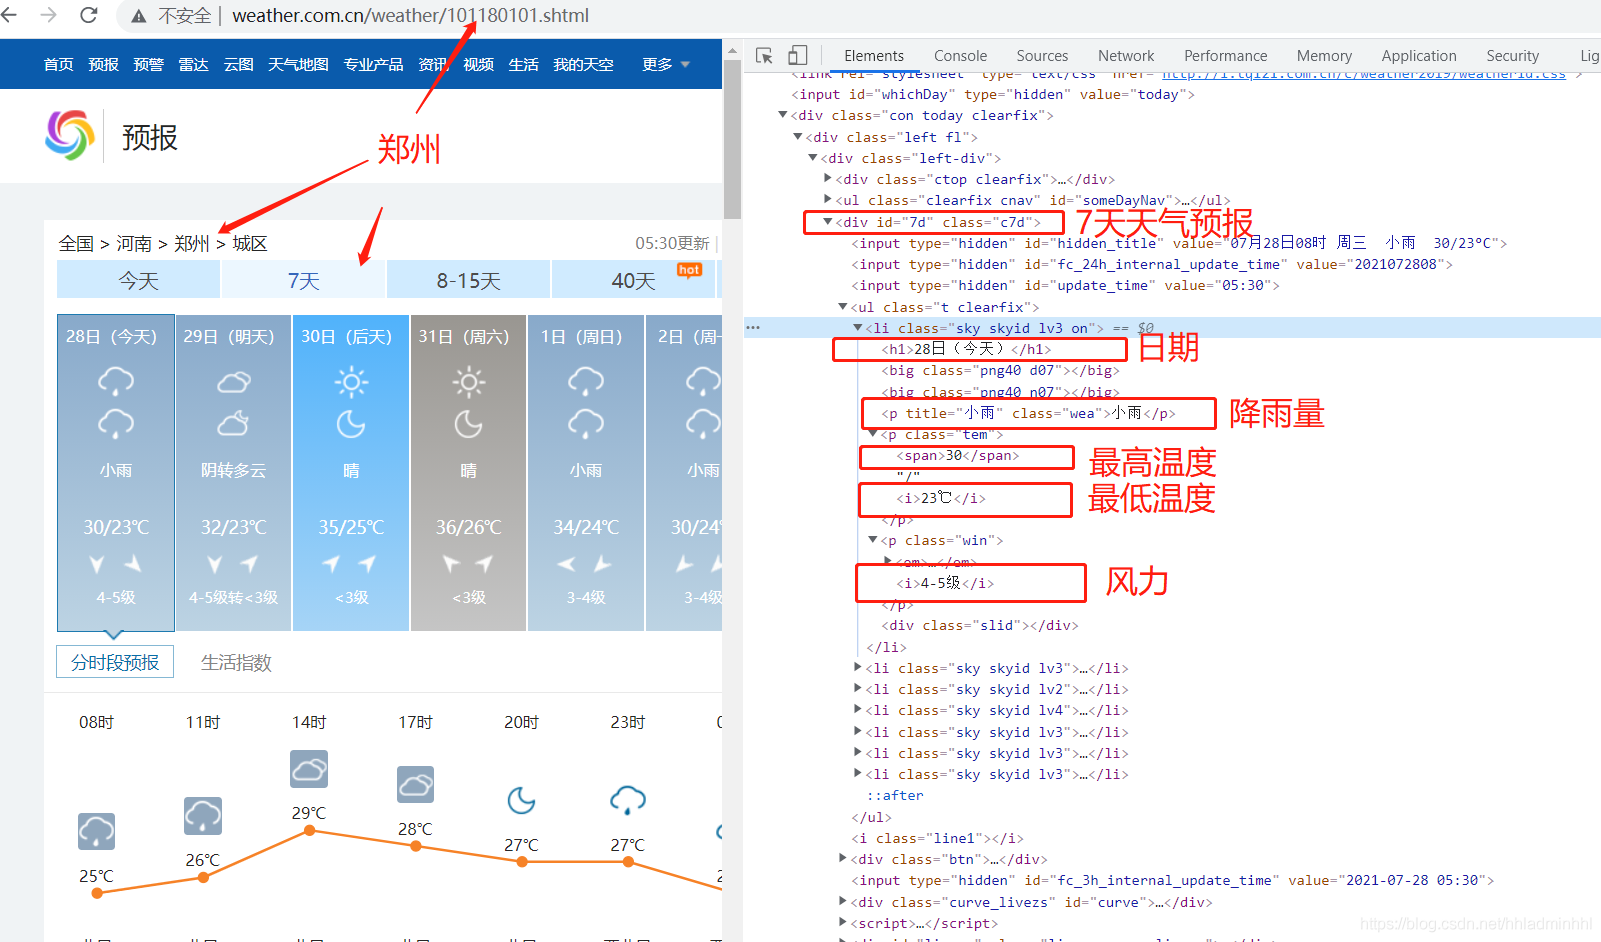
�������ǾͿ���ȫʡ�ĸ����ؼ����������ݱ��������ˡ�
2. ����缶�״�ͼ
ͳ��ȫʡ�ķ����ͷ���,��Ϊ��������ʹ���������ķ�ʽչ�ֱȽ�����,�������Dz��ü�����ķ�ʽչ��һ��ķ�������ͼ,��Բ��Ϊ8��,ÿһ�ݴ���һ������,�뾶����ƽ������,�������ŷ缶����,��ɫ���
def wind_radar(data):
"""�����״�ͼ"""
wind = list(data['��������'])
wind_speed = list(data['�缶'])
for i in range(0,24