我尝试了两种方式
用opencv 对指针仪表进行读数识别,
1. 先模板匹配,然后边缘检测 + 霍夫直线
2. 按轮廓大小过滤,然后边缘检测 + 霍夫直线
两种方式对光线都非常敏感
其中第一种的应用范围更广,背景复杂一点也能识别到
个人比较喜欢这种方式
第二种的限制多一点,对背景、光线条件要求比较高
对于固定位置,且明暗变化不大的情况下,这种方式还是很有效的
先说第一个方案,第二个方式就不说了
第一种方式:模板匹配,然后边缘检测 + 霍夫直线
if __name__ == "__main__":
# 加载模板
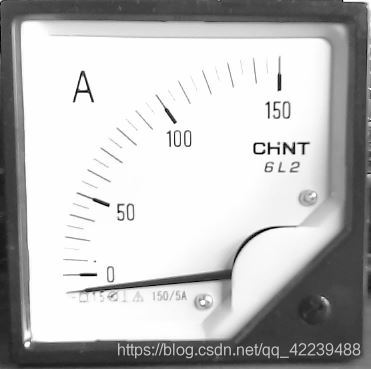
template = cv2.imread('./data/001.jpg',1)
# 初始化
am = C_ammerter(template)
# 运行
am.am_run()
# 结束
am.close()
模板图 001.jpg
下面给出def am_run(self)函数的处理流程 (整体比较乱~~~)
其中边缘检测之前需要对图像做一些处理:
def am_run(self):
while True:
ret, frame = self.cap.read()
if frame is None:
print('video picture is none --continue ')
continue
gray = frame.copy()
# cv2.imshow('origin', gray)
# 匹配模板 框出匹配区域
image = gray.copy()
maxval,t_left, b_right = self.get_match(gray)
if maxval < 16000000000: # 对匹配程度做判断
print("---------------------------------------")
print('matchTemplate is not enough --continue')
print("---------------------------------------")
result =frame
image=frame
else:
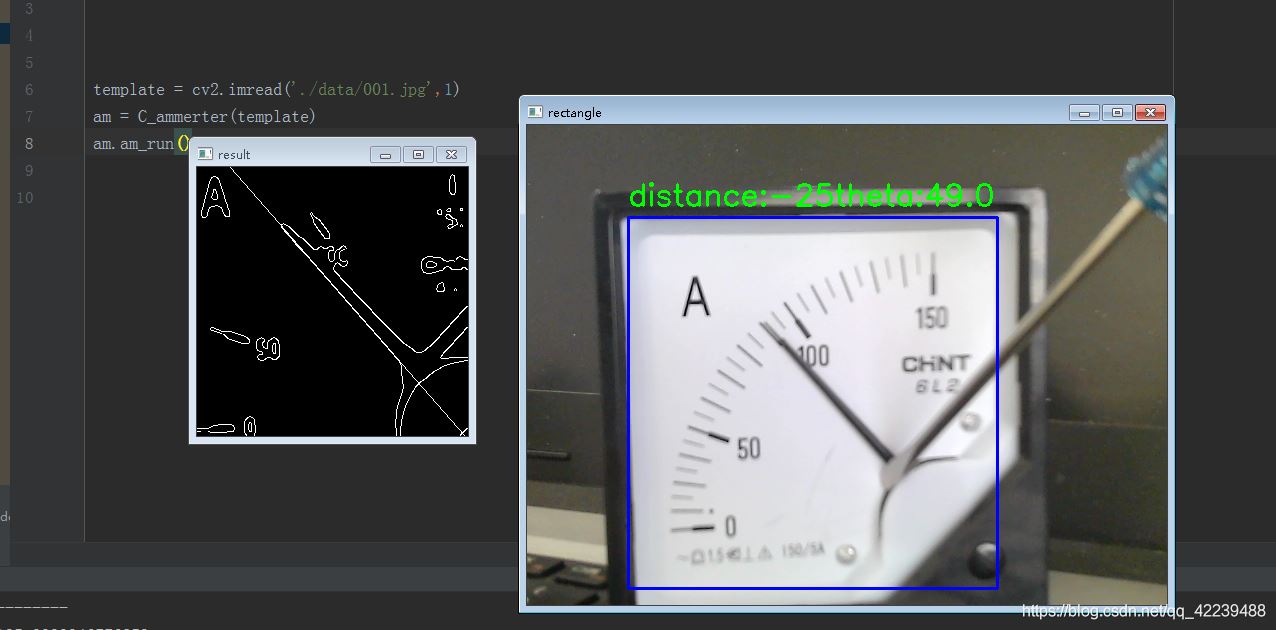
cv2.rectangle(image, t_left, b_right, 255, 2)
# 高斯除噪
kernel = np.ones((6,6), np.float32) / 36
gray_cut_filter2D = cv2.filter2D(image[t_left[1]:t_left[1] + self.h, t_left[0]:t_left[0] + self.w], -1, kernel)
# 灰度图 二值化
gray_img = cv2.cvtColor(gray_cut_filter2D, cv2.COLOR_BGR2GRAY)
ret, thresh1 = cv2.threshold(gray_img, 180, 255, cv2.THRESH_BINARY)
# 二值化后 分割主要区域 减小干扰 模板图尺寸371*369
tm = thresh1.copy()
test_main = tm[50:319, 50:321]
# 边缘化检测
edges = cv2.Canny(test_main, 50, 150, apertureSize=3)
# 霍夫直线
lines = cv2.HoughLines(edges, 1, np.pi / 180, 60)
if lines is None:
continue
result = edges.copy()
for line in lines[0]:
rho = line[0] # 第一个元素是距离rho
theta = line[1] # 第二个元素是角度theta
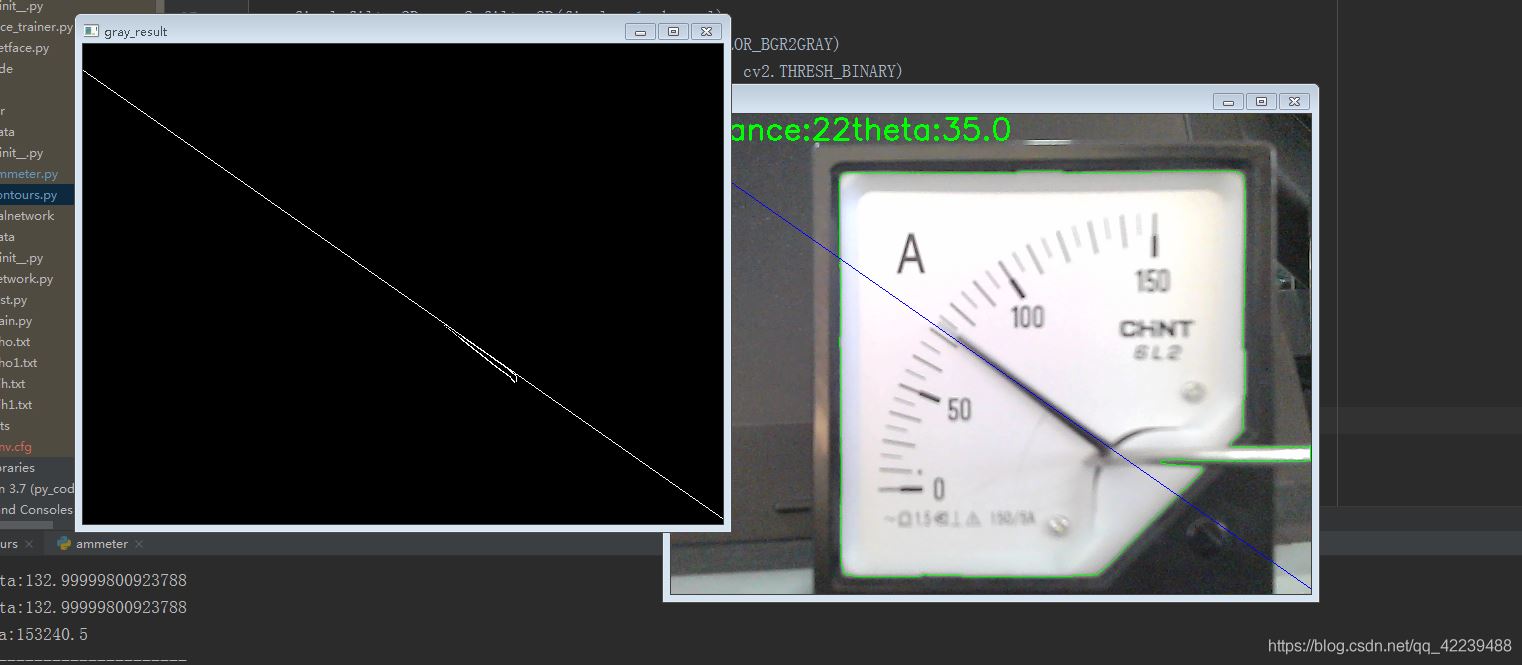
print('distance:' + str(rho), 'theta:' + str(((theta / np.pi) * 180)))
lbael_text = 'distance:' + str(round(rho))+ 'theta:' + str(round((theta / np.pi) * 180-90,2))
cv2.putText(image, lbael_text,(t_left[0],t_left[1]-12),cv2.FONT_HERSHEY_SIMPLEX,1,(0,255,0),2)
if (theta > 3 * (np.pi / 3)) or (theta < (np.pi / 2)): # 从图像边界画出延长直线
# 该直线与第一行的交点
pt1 = (int(rho / np.cos(theta)), 0)
# 该直线与最后一行的焦点
pt2 = (int((rho - result.shape[0] * np.sin(theta)) / np.cos(theta)), result.shape[0])
# 绘制一条白线
cv2.line(result, pt1, pt2,255, 1)
# print('theat >180 theta<90')
else: # 水平直线
# 该直线与第一列的交点
pt1 = (0, int(rho / np.sin(theta)))
# 该直线与最后一列的交点
pt2 = (result.shape[1], int((rho - result.shape[1] * np.cos(theta)) / np.sin(theta)))
# 绘制一条直线
cv2.line(result, pt1, pt2, 255, 1)
cv2.imshow('result', result)
cv2.imshow('rectangle', image)
if cv2.waitKey(1) & 0XFF == ord('q'):
break
js