马丁策略本来是一种赌博方法,但在投资界应用也很广泛,不过对于投资者来说马丁策略过于简单,所以本文将其改进并使得其在震荡市中获利,以下说明如何实现马丁策略。
策略
逢跌加仓,间隔由自己决定,每次加仓是当前仓位的一倍。
连续跌两次卖出,且卖出一半仓位。
如果爆仓则全仓卖出止损。
初始持仓设置为10%~25%,则可进行2到3次补仓。
初始化马丁策略类属性
def __init__(self,startcash, start, end):
 self.cash = startcash #初始化现金
 self.hold = 0 #初始化持仓金额
 self.holdper = self.hold /startcash #初始化仓位
 self.log = [] #初始化日志
 self.cost = 0 #成本价
 self.stock_num = 0 #股票数量
 self.starttime = start #起始时间
 self.endtime = end #终止时间
 self.quantlog = [] #交易量记录
 self.earn = [] #总资产记录
 self.num_log = []
 self.droplog = [0]
为了记录每次买卖仓位的变化初始化了各种列表。
交易函数
首先导入需要的模块
import pandas as pd
import numpy as np
import tushare as ts
import matplotlib.pyplot as plt
 def buy(self, currentprice, count):

 self.cash -= currentprice*count
 self.log.append('buy')
 self.hold += currentprice*count
 self.holdper = self.hold / (self.cash+ self.hold)
 self.stock_num += count
 self.cost = self.hold / self.stock_num
 self.quantlog.append(count//100)
 print('买入价:%.2f,手数:%d,现在成本价:%.2f,现在持仓:%.2f,现在筹码:%d' %(currentprice ,count//100, self.cost, self.holdper, self.stock_num//100))
 self.earn.append(self.cash+ currentprice*self.stock_num)
 self.num_log.append(self.stock_num)
 self.droplog = [0]

 def sell(self, currentprice, count):
 self.cash += currentprice*count
 self.stock_num -= count
 self.log.append('sell')
 self.hold = self.stock_num*self.cost
 self.holdper = self.hold / (self.cash + self.hold)
 #self.cost = self.hold / self.stock_num
 print('卖出价:%.2f,手数:%d,现在成本价:%.2f,现在持仓:%.2f,现在筹码:%d' %(currentprice ,count//100, self.cost, self.holdper, self.stock_num//100))
 self.quantlog.append(count//100)
 self.earn.append(self.cash+ currentprice*self.stock_num)
 self.num_log.append(self.stock_num)

 def holdstock(self,currentprice):
 self.log.append('hold')
 #print('持有,现在仓位为:%.2f。现在成本:%.2f' %(self.holdper,self.cost))
 self.quantlog.append(0)
 self.earn.append(self.cash+ currentprice*self.stock_num)
 self.num_log.append(self.stock_num)
持仓成本的计算方式是利用总持仓金额除以总手数,卖出时不改变持仓成本。持有则是不做任何操作只记录日志
数据接口
def get_stock(self, code):
 df=ts.get_k_data(code,autype='qfq',start= self.starttime ,end= self.endtime)
 df.index=pd.to_datetime(df.date)
 df=df[['open','high','low','close','volume']]
 return df
数据接口使用tushare,也可使用pro接口,到官网注册领取token。
token = '输入你的token'
pro = ts.pro_api()
ts.set_token(token)
 def get_stock_pro(self, code):
 code = code + '.SH'
 df = pro.daily(ts_code= code, start_date = self.starttime, end_date= self.endtime)
 return df
数据结构:

回测函数
 def startback(self, data, everyChange, accDropday):
 """
 回测函数
 """
 for i in range(len(data)):
  if i < 1:
  continue
  if i < accDropday:
  drop = backtesting.accumulateVar(everyChange, i, i)
  #print('现在累计涨跌幅度为:%.2f'%(drop))
  self.martin(data[i], data[i-1], drop, everyChange,i)
  elif i < len(data)-2:
  drop = backtesting.accumulateVar(everyChange, i, accDropday)
  #print('现在累计涨跌幅度为:%.2f'%(drop))
  self.martin(data[i],data[i-1], drop, everyChange,i)
  else:
  if self.stock_num > 0:
   self.sell(data[-1],self.stock_num)
  else: self.holdstock(data[i])
因为要计算每日涨跌幅,要计算差分,所以第一天的数据不能计算在for循环中跳过,accDropday是累计跌幅的最大计算天数,用来控制入场,当累计跌幅大于某个数值且仓位为0%时可再次入场。以下是入场函数:
def enter(self, currentprice,ex_price,accuDrop):
 if accuDrop < -0.01:#and ex_price > currentprice:
  count = (self.cash+self.hold) *0.24 // currentprice //100 * 100
  print('再次入场')
  self.buy(currentprice, count)
 else: self.holdstock(currentprice)
入场仓位选择0.24则可进行两次抄底,如果抄底间隔为7%可承受最大跌幅为14%。
策略函数
 def martin(self, currentprice, ex_price, accuDrop,everyChange,i):
 diff = (ex_price - currentprice)/ex_price
 self.droplog.append(diff)

 if sum(self.droplog) <= 0:
  self.droplog = [0]

 if self.stock_num//100 > 1:
  if sum(self.droplog) >= 0.04:
  if self.holdper*2 < 0.24:
   count =(self.cash+self.hold) *(0.25-self.holdper) // currentprice //100 * 100
   self.buy(currentprice, count)
  elif self.holdper*2 < 1 and (self.hold/currentprice)//100 *100 > 0 and backtesting.computeCon(self.log) < 5:
   self.buy(currentprice, (self.hold/currentprice)//100 *100)

  else: self.sell(currentprice, self.stock_num//100 *100);print('及时止损')

  elif (everyChange[i-2] < 0 and everyChange[i-1] <0 and self.cost < currentprice):# or (everyChange[i-1] < -0.04 and self.cost < currentprice):

  if (self.stock_num > 0) and ((self.stock_num*(1/2)//100*100) > 0):

   self.sell(currentprice, self.stock_num*(1/2)//100*100 )

   #print("现在累计涨跌幅为: %.3f" %(accuDrop))
  elif self.stock_num == 100: self.sell(currentprice, 100)
  else: self.holdstock(currentprice)
  else: self.holdstock(currentprice)
 else: self.enter(currentprice,ex_price,accuDrop)
首先构建了droplog专门用于计算累计涨跌幅,当其大于0时重置为0,每次购买后也将其重置为0。当跌幅大于0.04则买入,一下为流程图(因为作图软件Visustin为试用版所以有水印,两个图可以结合来看):
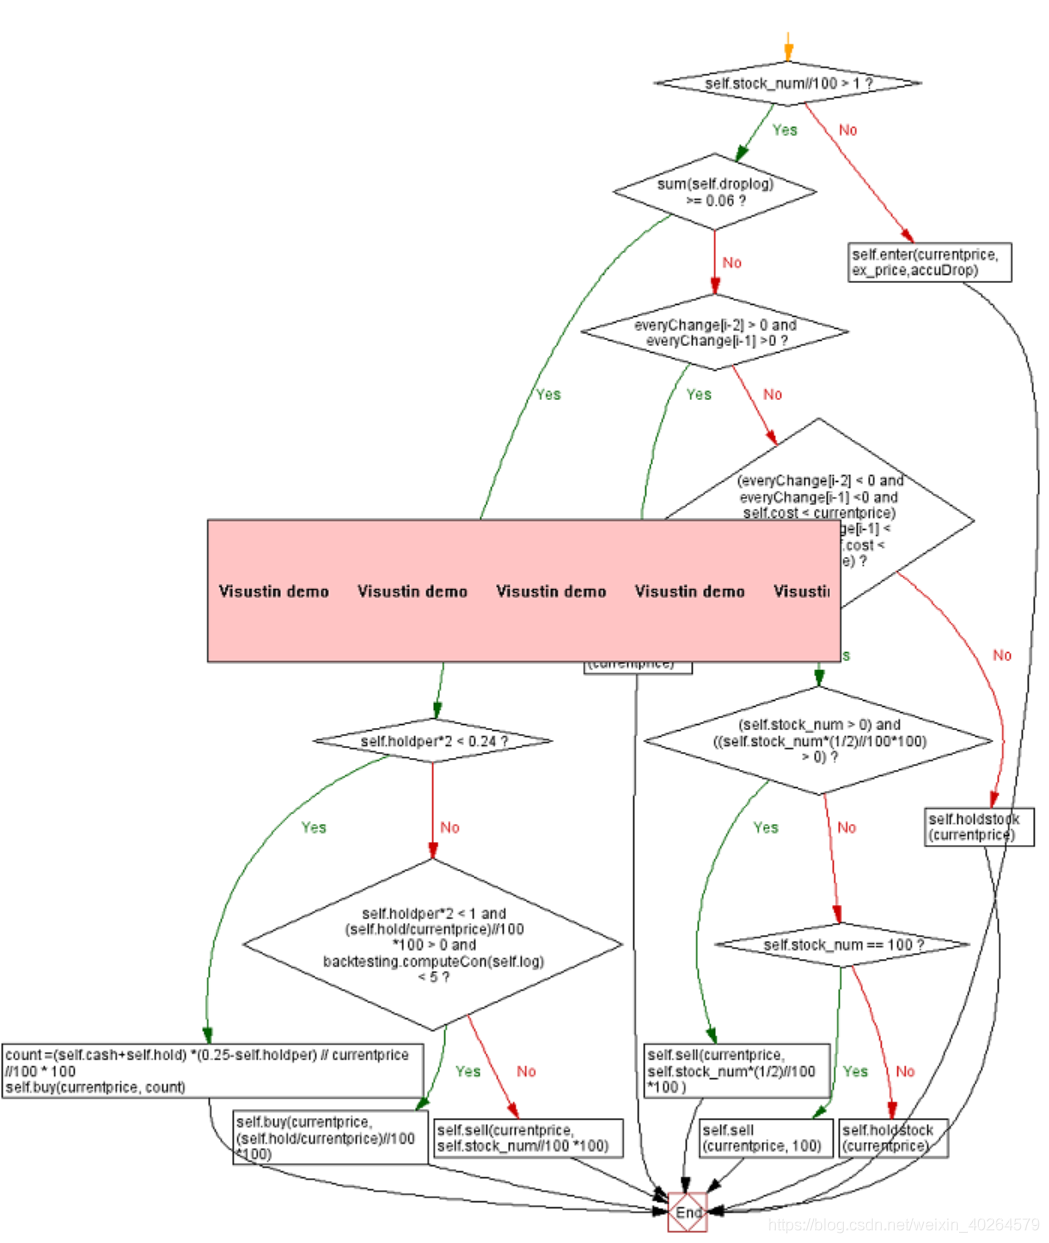
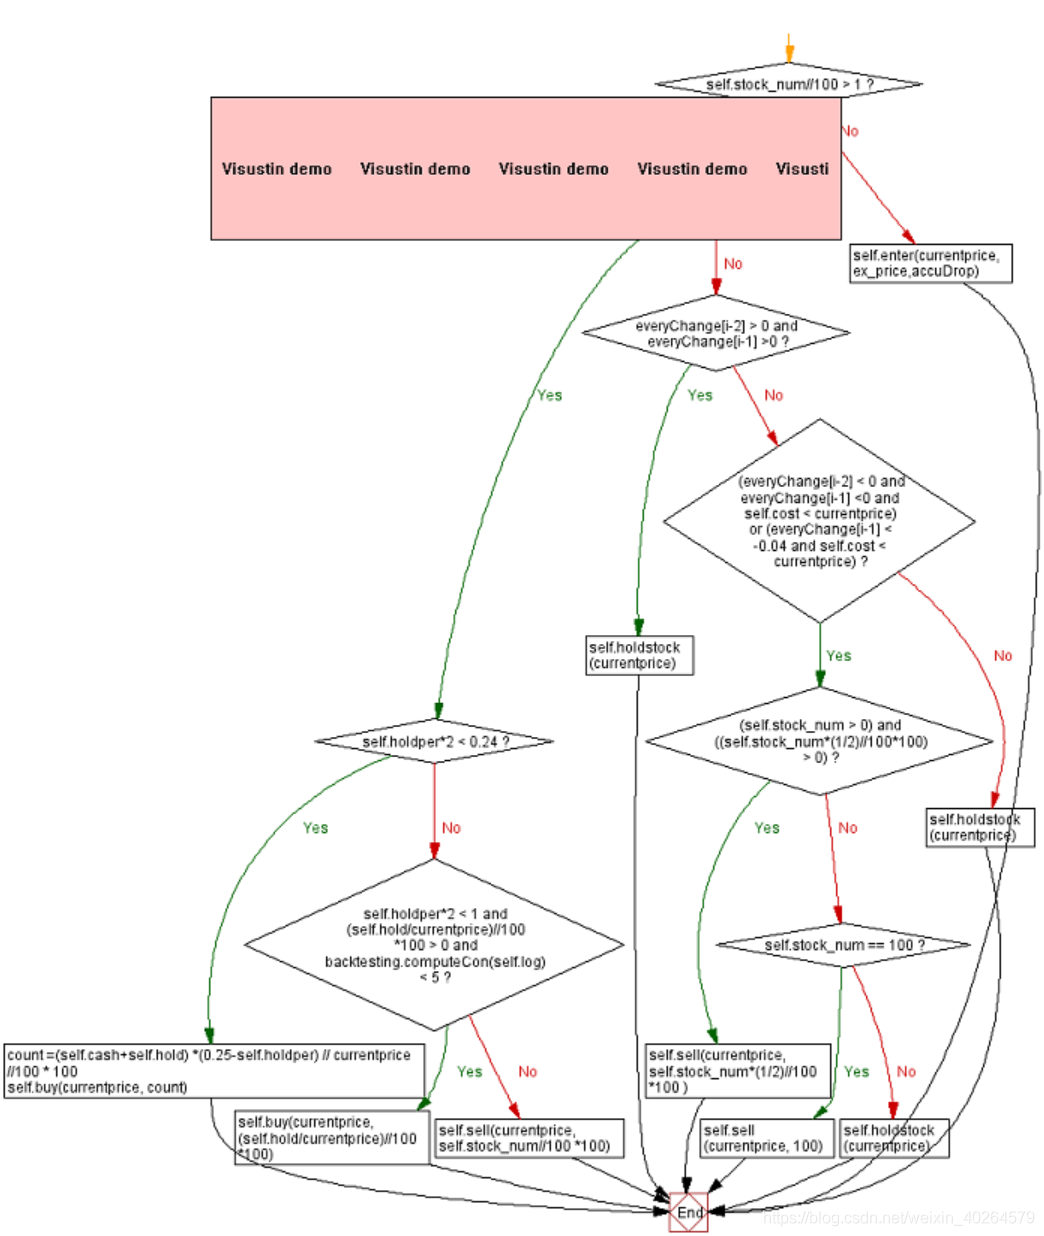
此策略函数可以改成其他策略甚至是反马丁,因为交易函数可以通用。
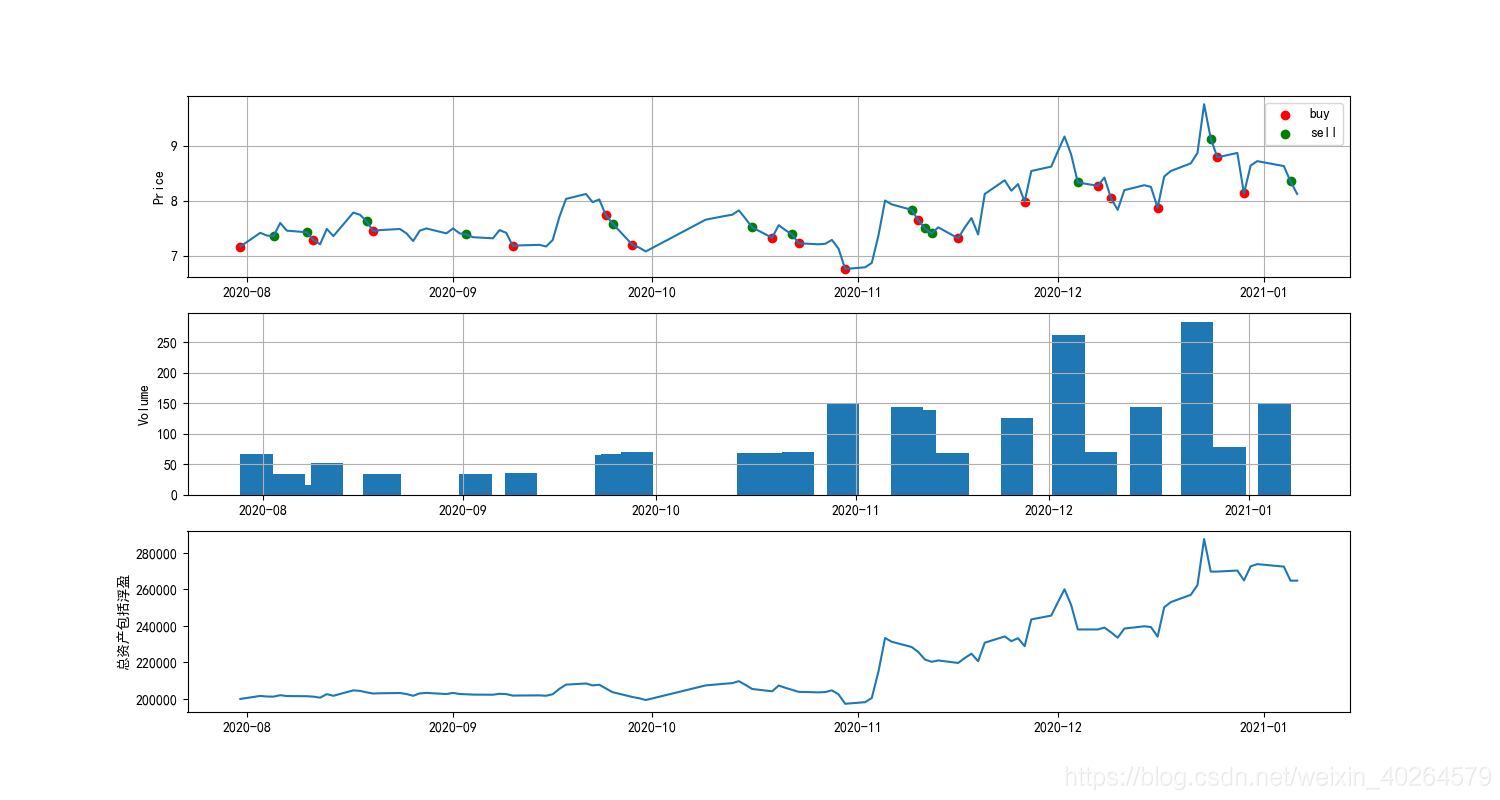
作图和输出结果
buylog = pd.Series(broker.log)
close = data.copy()
buy = np.zeros(len(close))
sell = np.zeros(len(close))
for i in range(len(buylog)):
 if buylog[i] == 'buy':
 buy[i] = close[i]
 elif buylog[i] == 'sell':
 sell[i] = close[i]

buy = pd.Series(buy)
sell = pd.Series(sell)
buy.index = close.index
sell.index = close.index
quantlog = pd.Series(broker.quantlog)
quantlog.index = close.index
earn = pd.Series(broker.earn)
earn.index = close.index

buy = buy.loc[buy > 0]
sell = sell.loc[sell>0]
plt.plot(close)
plt.scatter(buy.index,buy,label = 'buy')
plt.scatter(sell.index,sell, label = 'sell')
plt.title('马丁策略')
plt.legend()

#画图
plt.rcParams['font.sans-serif'] = ['SimHei']

fig, (ax1, ax2, ax3) = plt.subplots(3,figsize=(15,8))

ax1.plot(close)
ax1.scatter(buy.index,buy,label = 'buy',color = 'red')
ax1.scatter(sell.index,sell, label = 'sell',color = 'green')
ax1.set_ylabel('Price')
ax1.grid(True)
ax1.legend()

ax1.xaxis_date()
ax2.bar(quantlog.index, quantlog, width = 5)
ax2.set_ylabel('Volume')

ax2.xaxis_date()
ax2.grid(True)
ax3.xaxis_date()
ax3.plot(earn)
ax3.set_ylabel('总资产包括浮盈')
plt.show()
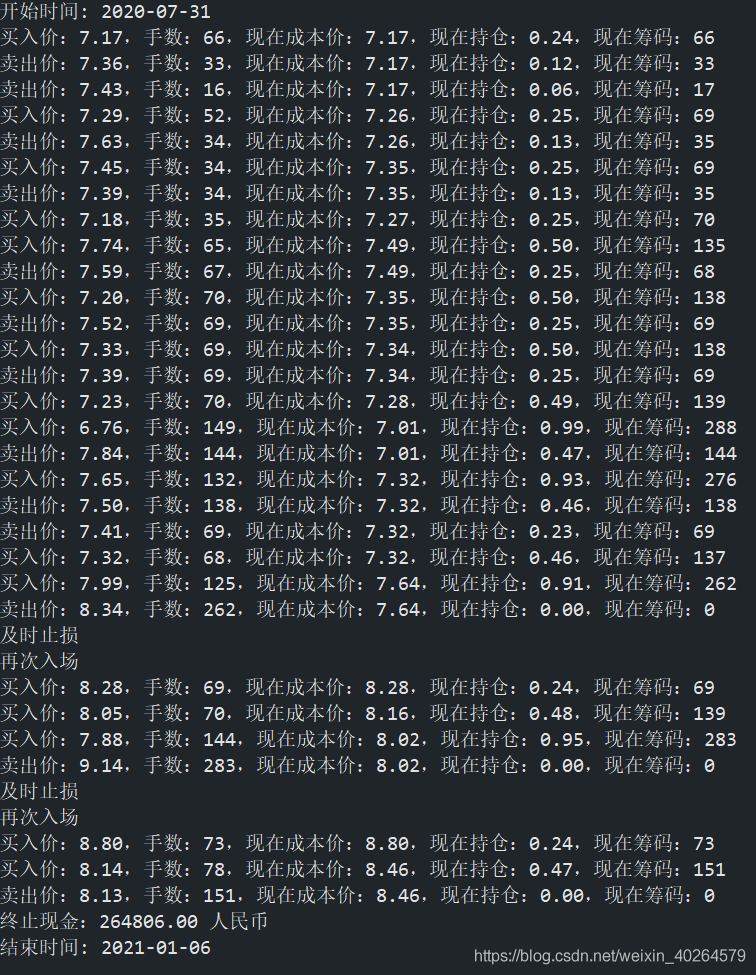
交易日志
js