
To better follow the energy consumption, the government wants energy suppliers to install smart meters in every home in England, Wales and Scotland. There are more than 26 million homes for the energy suppliers to get to, with the goal of every home having a smart meter by 2020.
This roll out of meter is lead by the European Union who asked all member governments to look at smart meters as part of measures to upgrade our energy supply and tackle climate change. After an initial study, the British government decided to adopt smart meters as part of their plan to update our ageing energy system.
In this dataset, you will find a refactorised version of the data from the London data store, that contains the energy consumption readings for a sample of 5,567 London Households that took part in the UK Power Networks led Low Carbon London project between November 2011 and February 2014. The data from the smart meters seems associated only to the electrical consumption.
ФПБъ: злКЯПМТЧЦјКђЁЂЪБМфЁЂМОНкЁЂНкШевдМАашЧѓЯьгІЕШвђЫи,ЪЕЯжИККЩдЄВтЙІФмЁЃ
Ъ§ОндД: https://www.kaggle.com/jeanmidev/smart-meters-in-london
ДІРэСїГЬ:
- НЋЫљгаЪ§ОнНјааКЯВЂ
- ИљОнУПЛЇУПЬьЕФФмдДЯћКФЪ§Он,ЖдВЛвЛжТЕФзЁЛЇЭГМЦЪ§ОнНјааЙцЗЖЛЏДІРэ
- ЬНЫїЬьЦјзДПіЕШвђЫиКЭФмдДЯћКФжЎМфЕФЙиЯЕ
- НЋгЂЙњМйШеЪ§ОнЬэМгЕНШеЫЎЦНЪ§ОнжазїЮЊжИБъ
- ФтКЯSARIMAXФЃаЭ
- ФтКЯLSTMФЃаЭ
ФПТМНсЙЙ:

ЛЗОГ:
Keras==2.0.2
TensorFlow==1.15.5
scikit-learn==0.24.1
Ъ§ОнећКЯ
def first():
for num in range(0,112):
df = pd.read_csv("data/daily_dataset/block_"+str(num)+".csv")
df = df[['day','LCLid','energy_sum']]
df.reset_index()
df.to_csv("data/hc/hc_"+str(num)+".csv")
fout= open("data/energy.csv","a")
for line in open("data/hc/hc_0.csv"):
fout.write(line)
for num in range(0,112):
f = open("data/hc/hc_"+str(num)+".csv")
f.readline()
for line in f:
fout.write(line)
f.close()
fout.close()
first()
ИїИіМвЭЅЕФЪ§ОнЪеМЏЪЧВЛЭЌЕФ,вђДЫЮвУЧНЋЪЙгУЁАУПИіМвЭЅЕФФмдДЁБзїЮЊдЄВтЕФФПБъ,ЖјВЛЪЧНіНіЪЙгУФмдДЁЃ
ШЛЖјгаЯрЕБЖрЕФЖРЬиЕФМвЭЅ,ЫљвдашвЊЖрДЮГіРД,ЮвУЧЕФзюжеФПБъЪЧдЄВтећЬхЯћЗбдЄВт,ЖјВЛЪЧдкМвЭЅЫЎЦНЁЃ
energy = pd.read_csv('data/energy.csv')
housecount = energy.groupby('day')[['LCLid']].nunique()
energy = energy.groupby('day')[['energy_sum']].sum()
energy = energy.merge(housecount, on = ['day'])
energy = energy.reset_index()
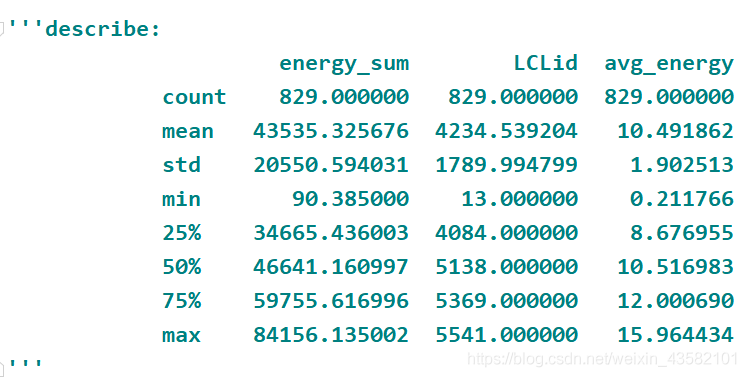
energy.count()
energy.day = pd.to_datetime(energy.day,format='%Y-%m-%d').dt.date
energy['avg_energy'] = energy['energy_sum']/energy['LCLid']
ЬьЦјаХЯЂ
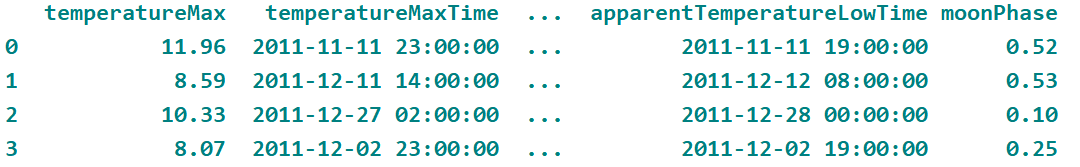
weather = pd.read_csv('data/weather_daily_darksky.csv')
print(weather.head(4))
weather['day']= pd.to_datetime(weather['time'])
weather['day']= pd.to_datetime(weather['day'],format='%Y%m%d').dt.date
weather = weather[['temperatureMax', 'windBearing', 'dewPoint', 'cloudCover', 'windSpeed',
'pressure', 'apparentTemperatureHigh', 'visibility', 'humidity',
'apparentTemperatureLow', 'apparentTemperatureMax', 'uvIndex',
'temperatureLow', 'temperatureMin', 'temperatureHigh',
'apparentTemperatureMin', 'moonPhase','day']]
weather = weather.dropna()
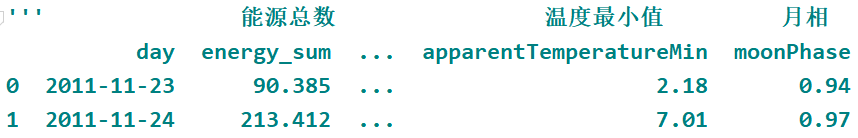
weather_energy = energy.merge(weather,on='day')
plt.rcParams['font.sans-serif'] = ['SimHei']
plt.rcParams['axes.unicode_minus'] = False
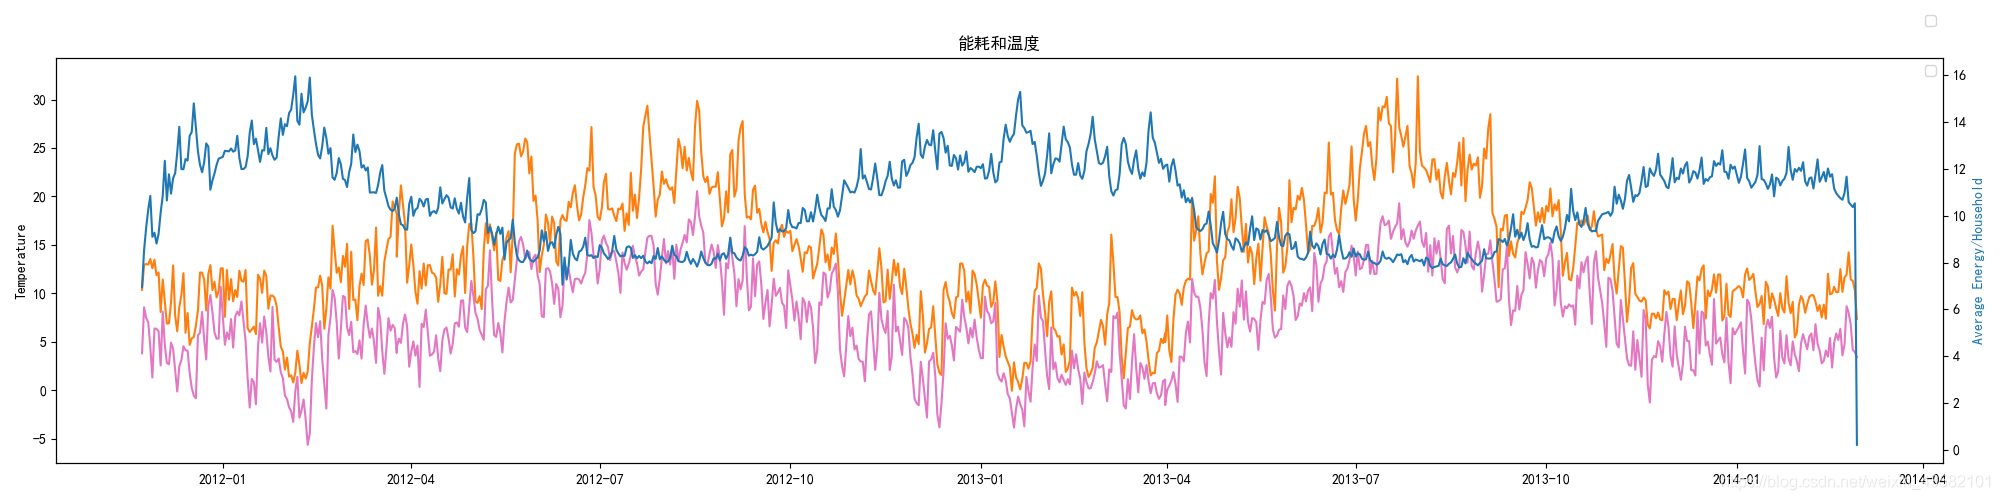
def drow1():
fig, ax1 = plt.subplots(figsize = (20,5))
ax1.plot(weather_energy.day, weather_energy.temperatureMax, color = 'tab:orange')
ax1.plot(weather_energy.day, weather_energy.temperatureMin, color = 'tab:pink')
ax1.set_ylabel('Temperature')
ax1.legend()
ax2 = ax1.twinx()
ax2.plot(weather_energy.day,weather_energy.avg_energy,color = 'tab:blue')
ax2.set_ylabel('Average Energy/Household',color = 'tab:blue')
ax2.legend(bbox_to_anchor=(0.0, 1.02, 1.0, 0.102))
plt.title('ФмКФКЭЮТЖШ')
fig.tight_layout()
plt.show()
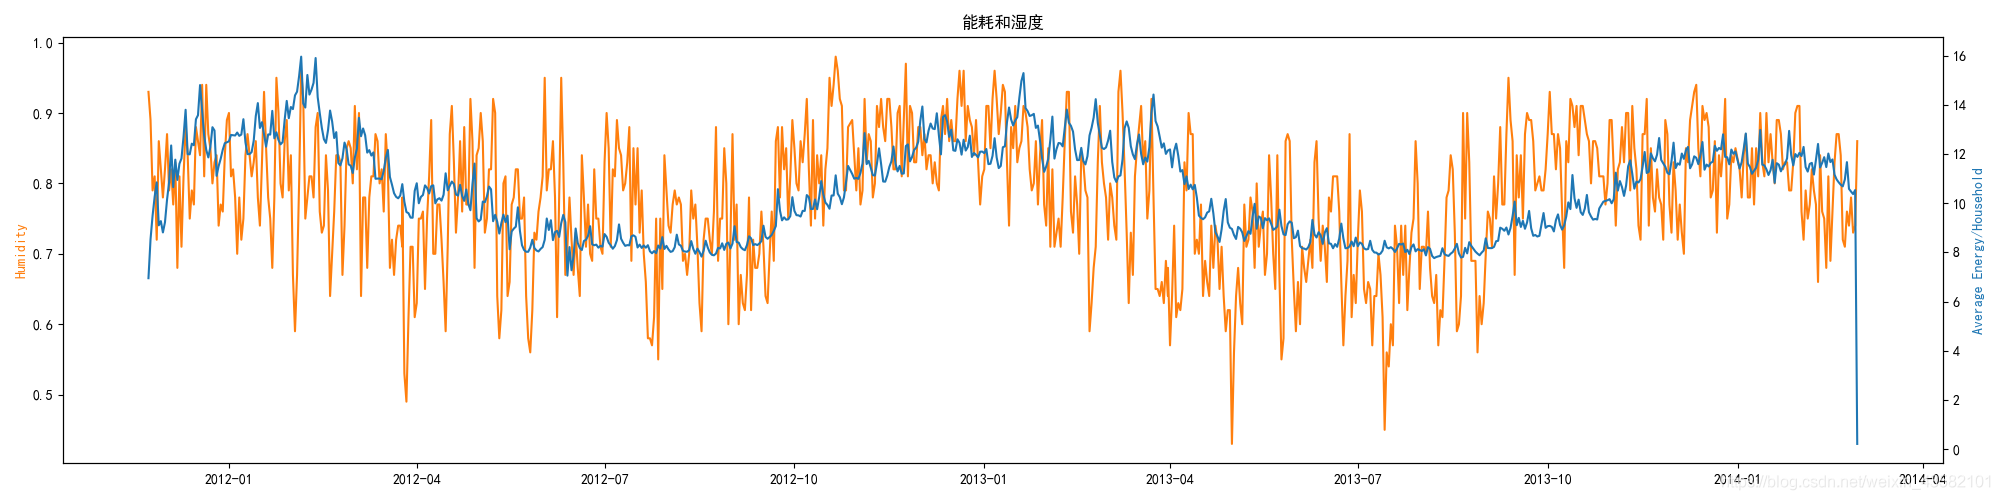
def drow2():
fig, ax1 = plt.subplots(figsize = (20,5))
ax1.plot(weather_energy.day, weather_energy.humidity, color = 'tab:orange')
ax1.set_ylabel('Humidity',color = 'tab:orange')
ax2 = ax1.twinx()
ax2.plot(weather_energy.day,weather_energy.avg_energy,color = 'tab:blue')
ax2.set_ylabel('Average Energy/Household',color = 'tab:blue')
plt.title('ФмКФКЭЪЊЖШ')
fig.tight_layout()
plt.show()
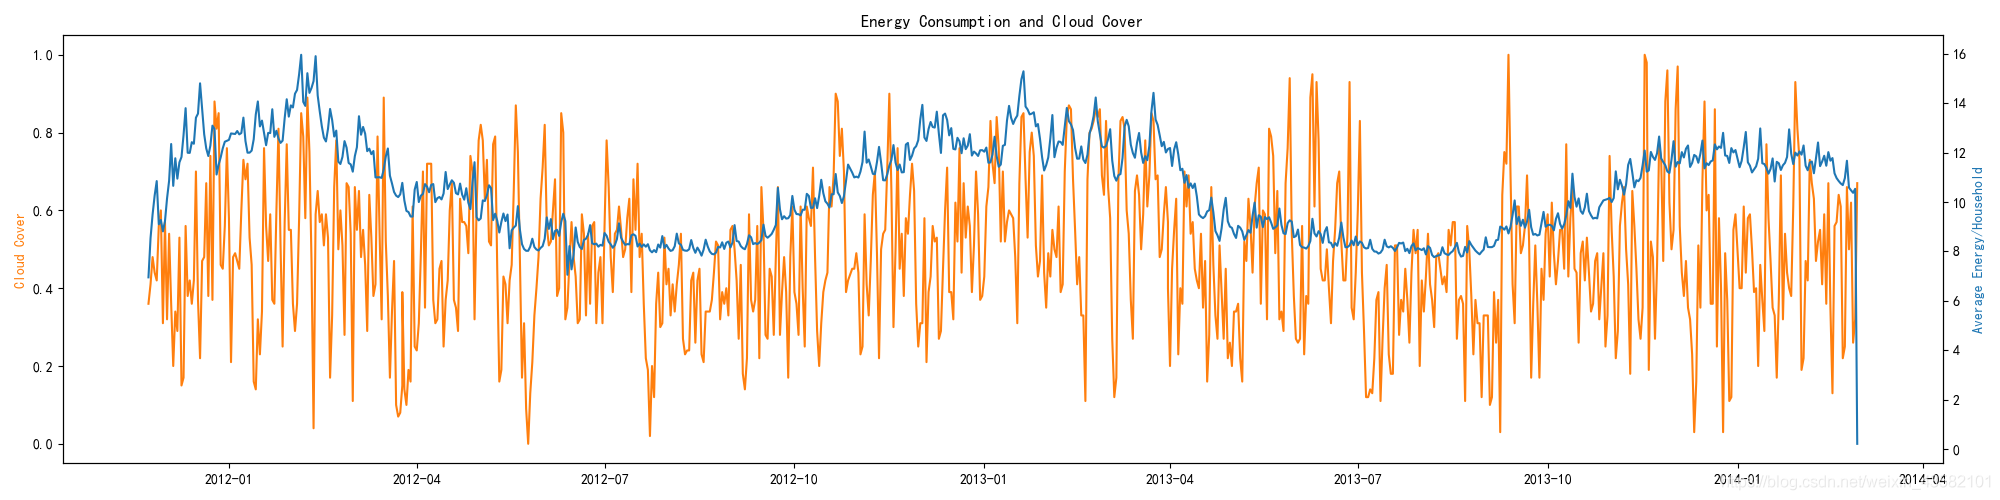
def drow3():
fig, ax1 = plt.subplots(figsize = (20,5))
ax1.plot(weather_energy.day, weather_energy.cloudCover, color = 'tab:orange')
ax1.set_ylabel('Cloud Cover',color = 'tab:orange')
ax2 = ax1.twinx()
ax2.plot(weather_energy.day,weather_energy.avg_energy,color = 'tab:blue')
ax2.set_ylabel('Average Energy/Household',color = 'tab:blue')
plt.title('Energy Consumption and Cloud Cover')
fig.tight_layout()
plt.show()
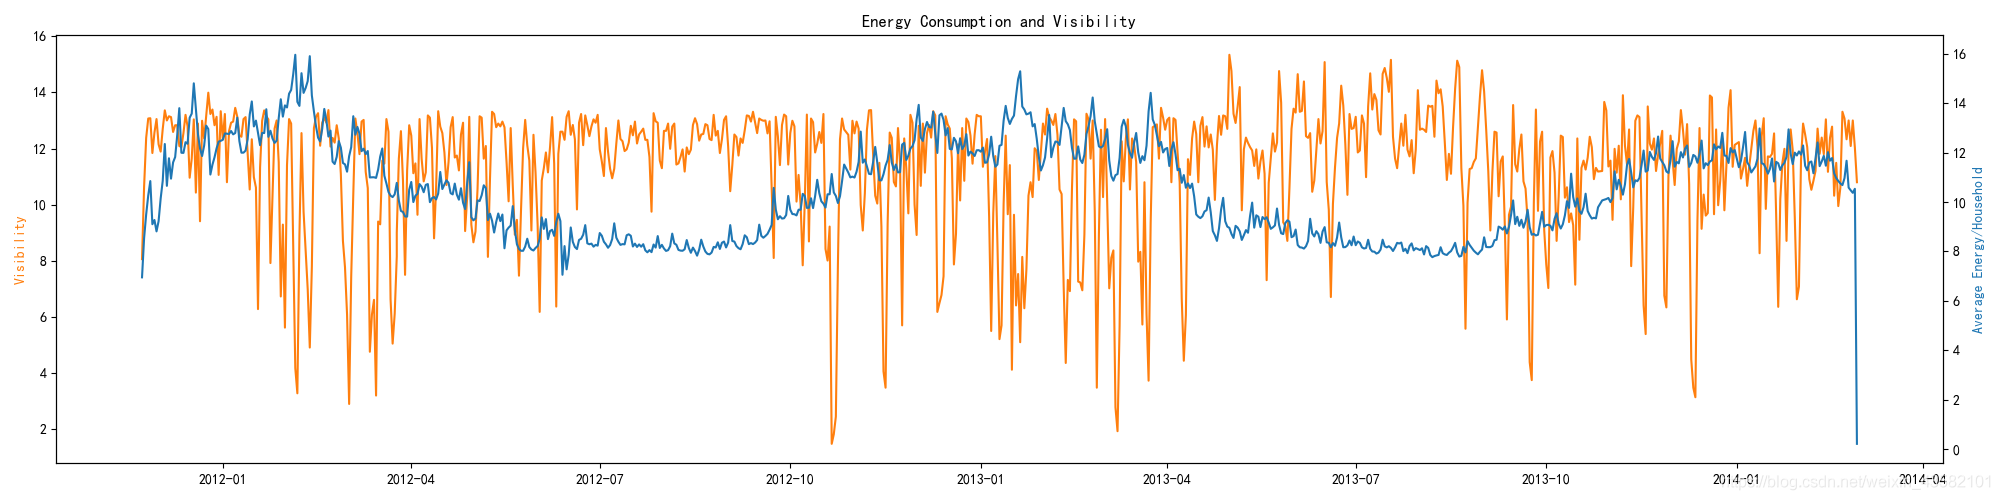
def drow4():
fig, ax1 = plt.subplots(figsize = (20,5))
ax1.plot(weather_energy.day, weather_energy.visibility, color = 'tab:orange')
ax1.set_ylabel('Visibility',color = 'tab:orange')
ax2 = ax1.twinx()
ax2.plot(weather_energy.day,weather_energy.avg_energy,color = 'tab:blue')
ax2.set_ylabel('Average Energy/Household',color = 'tab:blue')
plt.title('Energy Consumption and Visibility')
fig.tight_layout()
plt.show()
def drow5():
fig, ax1 = plt.subplots(figsize = (20,5))
ax1.plot(weather_energy