原理
经度 phi,纬度 theta 处的坐标为:
x =R* cos(phi) * cos(theta)
y = Rsin(phi) * cos(theta)
z = Rsin(theta)
问题
经纬度采样的采样点是相同经纬度间隔的交点。但是采样1000个点,如何划分多少条经线,多少条纬线相交,才能使1000个采样点最均匀的分布在球面上(虽然经纬度采样本来就不均匀,但对于不同的采样点个数应该有一种相对最均匀的经纬线划分)?求大佬指教!
我目前是将纬度每10度进行划分。
Code
import random
from mpl_toolkits import mplot3d
import numpy as np
import math
import matplotlib.pyplot as plt
%matplotlib inline
ax=plt.axes(projection="3d")

N=1000
x=[]
y=[]
z=[]
r=1


#经度
def longitude(lng):
  phi=(180+lng)*(math.pi/180)
  return phi

#纬度
def latitude(lat):
  theta=lat*(math.pi/180)
  return theta

for i in range(-80,90,10):
  for j in np.arange(-180,180,360/((N-2)/17)):
    #x.append(-r*math.sin(latitude(i))*math.cos(longitude(j)))
    #y.append(r*math.cos(latitude(i)))
    #z.append(r*math.sin(latitude(i))*math.sin(longitude(j)))

    x.append(r*math.cos(latitude(i))*math.cos(longitude(j)))
    z.append(r*math.sin(latitude(i)))
    y.append(r*math.cos(latitude(i))*math.sin(longitude(j)))

x.append(r*math.cos(latitude(-90))*math.cos(longitude(0)))
z.append(r*math.sin(latitude(-90)))
y.append(r*math.cos(latitude(-90))*math.sin(longitude(0)))

x.append(r*math.cos(latitude(90))*math.cos(longitude(0)))
z.append(r*math.sin(latitude(90)))
y.append(r*math.cos(latitude(90))*math.sin(longitude(0)))

xline=np.array(x)
yline=np.array(y)
zline=np.array(z)
print(xline.shape)
ax.scatter3D(xline,yline,zline,s=2)
plt.savefig("D:\\samples\\经纬度采样.png")
效果
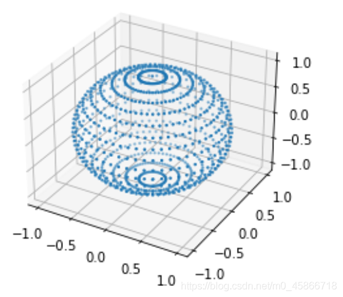
到此这篇关于python实现经纬度采样的示例代码的文章就介绍到这了,更多相关python 经纬度采样内容请搜索站长博客以前的文章或继续浏览下面的相关文章希望大家以后多多支持站长博客!
jsjbwy