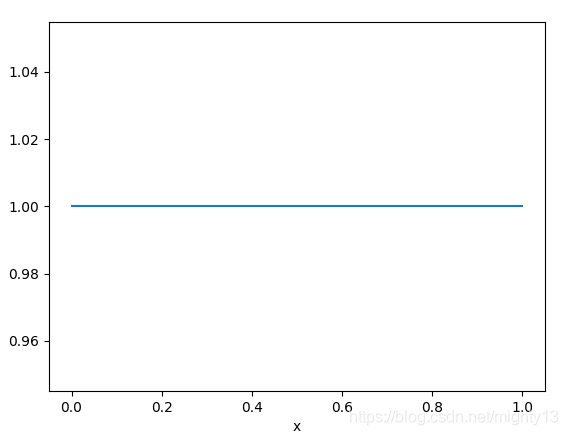
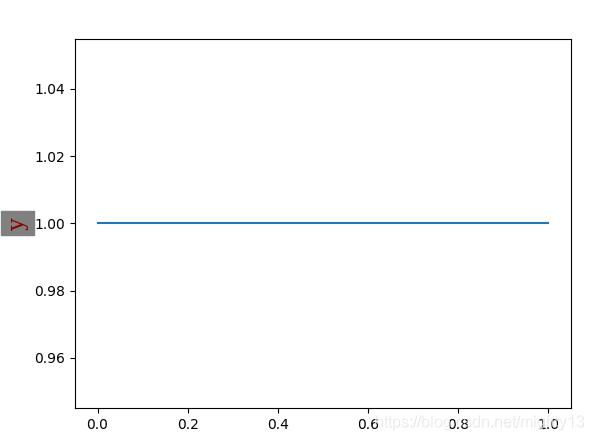
在pyplot模块中可以使用xlabel()和ylabel()函数设置x轴y轴的标签。这两个函数的使用方法非常相似。
使用xlabel()设置x轴标签
函数签名为matplotlib.pyplot.xlabel(xlabel, fontdict=None, labelpad=None, *, loc=None, **kwargs)
参数作用及取值如下:
xlabel:类型为字符串,即标签的文本。labelpad:类型为浮点数,默认值为None,即标签与坐标轴的距离。loc:取值范围为{'left', 'center', 'right'},默认值为rcParams["xaxis.labellocation"]('center'),即标签的位置。**kwargs:Text 对象关键字属性,用于控制文本的外观属性,如字体、文本颜色等。
返回值为Text对象。
xlabel()相关rcParams为:
#axes.labelsize:   medium # fontsize of the x any y labels
#axes.labelpad:   4.0   # space between label and axis
#axes.labelweight:  normal # weight of the x and y labels
#axes.labelcolor:  black
#xaxis.labellocation: center # alignment of the xaxis label: {left, right, center}
底层相关函数为:
Axes.set_xlabel(xlabel, fontdict=None, labelpad=None, *, loc=None, **kwargs)
Axes.get_xlabel()
案例
设置x轴标签,并输出xlabel函数的返回值。
返回值为Text对象,输出返回值的属性可知,标签文本的属性为_text。如果想获取标签文本,可使用Axes.get_xlabel方法获取。
import matplotlib.pyplot as plt

plt.plot([1, 1])
a = plt.xlabel("x")
print(a)
print(vars(a))
print(a._text)
print(plt.gca().get_xlabel())
plt.show()
输出:

Text(0.5, 0, 'x')
{'_stale': True, 'stale_callback': None, '_axes': None, 'figure': <Figure size 640x480 with 1 Axes>, '_transform': <matplotlib.transforms.BlendedAffine2D object at 0x0000019EC1471F98>, '_transformSet': True, '_visible': True, '_animated': False, '_alpha': None, 'clipbox': None, '_clippath': None, '_clipon': True, '_label': '', '_picker': None, '_contains': None, '_rasterized': None, '_agg_filter': None, '_mouseover': False, 'eventson': False, '_oid': 0, '_propobservers': {}, '_remove_method': None, '_url': None, '_gid': None, '_snap': None, '_sketch': None, '_path_effects': [], '_sticky_edges': _XYPair(x=[], y=[]), '_in_layout': True, '_x': 0.5, '_y': 0, '_text': 'x', '_color': 'black', '_fontproperties': <matplotlib.font_manager.FontProperties object at 0x0000019EC1471BE0>, '_usetex': False, '_wrap': False, '_verticalalignment': 'top', '_horizontalalignment': 'center', '_multialignment': None, '_rotation': None, '_bbox_patch': None, '_renderer': None, '_linespacing': 1.2, '_rotation_mode': None}
x
x
使用ylabel()设置y轴标签
函数签名为matplotlib.pyplot.ylabel(ylabel, fontdict=None, labelpad=None, *, loc=None, **kwargs)
参数作用及取值如下:
ylabel:类型为字符串,即标签的文本。labelpad:类型为浮点数,默认值为None,即标签与坐标轴的距离。loc:取值范围为{'bottom', 'center', 'top'},默认值为rcParams["yaxis.labellocation"]('center'),即标签的位置。**kwargs:Text 对象关键字属性,用于控制文本的外观属性,如字体、文本颜色等。
返回值为Text对象。
xlabel()相关rcParams为:
#axes.labelsize:   medium # fontsize of the x any y labels
#axes.labelpad:   4.0   # space between label and axis
#axes.labelweight:  normal # weight of the x and y labels
#axes.labelcolor:  black
#yaxis.labellocation: center # alignment of the yaxis label: {bottom, top, center}
底层相关函数为:
Axes.set_ylabel(ylabel, fontdict=None, labelpad=None, *, loc=None, **kwargs)
Axes.get_ylabel()
案例
添加y轴标签,并设置字体属性和背景色。
import matplotlib.pyplot as plt

font = {'family': 'serif',
    'color': 'darkred',
    'weight': 'normal',
    'size': 16,
    }
plt.plot([1, 1])
plt.ylabel("y", fontdict=font, backgroundcolor='grey')

plt.show()

到此这篇关于matplotlib之pyplot模块坐标轴标签设置使用(xlabel()、ylabel())的文章就介绍到这了,更多相关matplotlib 坐标轴标签内容请搜索站长博客以前的文章或继续浏览下面的相关文章希望大家以后多多支持站长博客!
jsjbwy


