今天给大家介绍一个非常 NB 的Python 库,专门用来绘制地图的,它叫 Folium 。
1. Folium简介
Folium是一个基于leaflet.js的Python地图库,其中,Leaflet是一个非常轻的前端地图可视化库。即可以使用Python语言调用Leaflet的地图可视化能力。它不单单可以在地图上展示数据的分布图,还可以使用Vincent/Vega在地图上加以标记。Folium可以让你用Python强大生态系统来处理数据,然后用Leaflet地图来展示。
Folium中有许多来自OpenStreetMap、MapQuest Open、MapQuestOpen Aerial、Mapbox和Stamen的内建地图元件,而且支持使用Mapbox或Cloudmade的API密钥来定制个性化的地图元件。Folium支持GeoJSON和TopoJSON两种文件格式的叠加,也可以将数据连接到这两种文件格式的叠加层,最后可使用color-brewer配色方案创建分布图。
2. Folium的使用
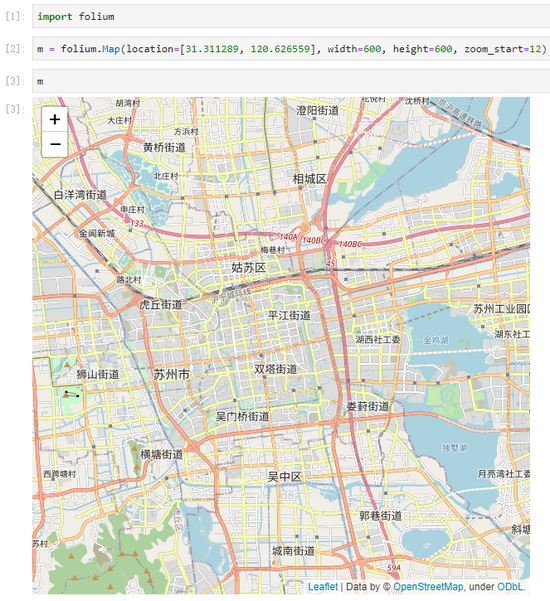
地图的生成
img
folium.folium.Map()详解
folium.folium.Map(location=None, width='100%', height='100%', left='0%', top='0%', position='relative', tiles='OpenStreetMap', attr=None, min_zoom=0, max_zoom=18, zoom_start=10, min_lat=-90, max_lat=90, min_lon=-180, max_lon=180, max_bounds=False, crs='EPSG3857', control_scale=False, prefer_canvas=False, no_touch=False, disable_3d=False, png_enabled=False, zoom_control=True, **kwargs)
参数说明:
location (tuple or list, default None):纬度和经度
width (pixel int or percentage string (default: ‘100%')):地图宽度
height (pixel int or percentage string (default: ‘100%')):地图高度
tiles (str, default ‘OpenStreetMap') :瓦片名称或使用TileLayer classass.
min_zoom (int, default 0):地图可缩放的最小级别
max_zoom (int, default 18):地图可缩放的最大级别
zoom_start (int, default 10) :地图的初始缩放级别
attr (string, default None):当使用自定义瓦片时,传入自定义瓦片的名词
crs (str, default ‘EPSG3857') :投影坐标系标识
EPSG3857: Web墨卡托投影后的平面地图,坐标单位为米。大部分国外地图使用的时该标准。
EPSG4326: Web墨卡托投影后的平面地图,但仍然使用WGS84的经度、纬度表示坐标。
EPSG3395: 墨卡托投影,主要用于航海图
Simple: 简单的x,y匹配,用于自定义瓦片(比如游戏地图)
control_scale (bool, default False) :是否在地图上显示缩放标尺
prefer_canvas (bool, default False):强制使用Canvas渲染
no_touch (bool, default False) :是否允许触摸事件
disable_3d (bool, default False) :强制使用CSS 3D效果
zoom_control (bool, default True) :是否要限制zoom操作
**kwargs :Leaflets地图类的其他参数: https://leafletjs.com/reference-1.5.1.html#map“tiles”参数可选值:
“OpenStreetMap”
“Mapbox Bright” (Limited levels of zoom for free tiles)
“Mapbox Control Room” (Limited levels of zoom for free tiles)
“Stamen” (Terrain, Toner, and Watercolor)
“Cloudmade” (Must pass API key)
“Mapbox” (Must pass API key)
“CartoDB” (positron and dark_matter)
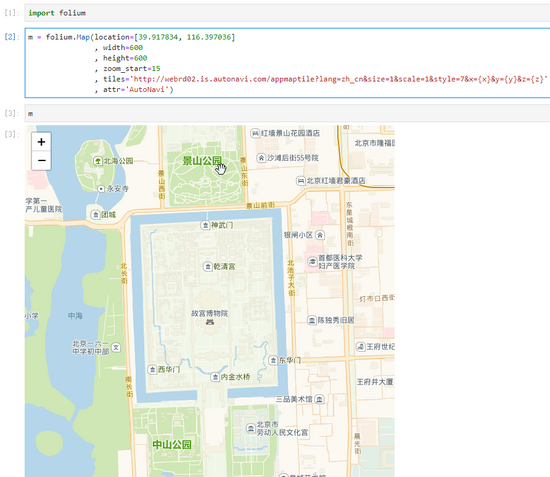
“tiles”的自定义设置:
img
地球上同一个地理位置的经纬度,在不同的坐标系中,会有少量偏移,国内目前常见的坐标系主要分为三种:
地球坐标系――WGS84:常见于GPS设备,Google地图等国际标准的坐标体系。
火星坐标系――GCJ-02:中国国内使用的被强制加密后的坐标体系,高德坐标就属于该种坐标体系。
百度坐标系――BD-09:百度地图所使用的坐标体系,是在火星坐标系的基础上又进行了一次加密处理。
所以在设置“tiles”时需要考虑目前手中得经纬度属于那种坐标系。
由于投影坐标系中没有GCJ-02和BD-09对应的标识,所以在自定义瓦片时主要经纬度能匹配上,crs中的设置可保持不变。更多详情介绍请看:瓦片坐标系学习
如果需要将地图保存,只需执行:m.save(“map.html”) 即可。
添加点、线、面要素
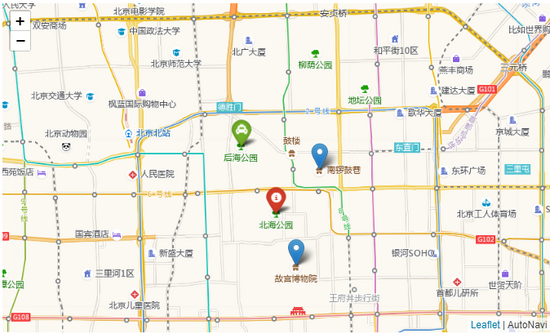
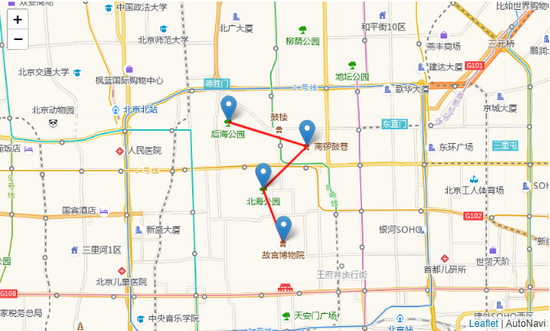
添加点
import folium m = folium.Map(location=[39.917834, 116.397036], zoom_start=13, width='50%',height='50%', zoom_control='False', tiles='http://webrd02.is.autonavi.com/appmaptile?lang=zh_cn&size=1&scale=1&style=8&x={x}&y={y}&z={z}<ype=6',attr='AutoNavi') tooltip ='请点击我查看该点信息' folium.Marker([39.937282,116.403187], popup='南锣鼓巷',tooltip=tooltip).add_to(m) folium.Marker([39.917834,116.397036], popup='故宫',tooltip=tooltip).add_to(m) folium.Marker([39.928614,116.391746], popup='北海公园', tooltip=tooltip, icon=folium.Icon(color='red')).add_to(m) folium.Marker([39.942143,116.382590], popup='后海公园', tooltip=tooltip, icon=folium.Icon(color='green', prefix='fa', icon='taxi')).add_to(m) m
img
Folium.Icon类可以设置color, icon_color, icon, angle, prefix这5个参数:
color的可选项包括:[‘red', ‘blue', ‘green', ‘purple', ‘orange', ‘darkred', ‘lightred', ‘beige', ‘darkblue', ‘darkgreen', ‘cadetblue', ‘darkpurple', ‘white', ‘pink', ‘lightblue', ‘lightgreen', ‘gray', ‘black', ‘lightgray'] ,或者HTML颜色代码
icon_color同上
icon可以在Font-Awesome网站中找到对应的名字,并设置prefix参数为'fa'
angle以度为单位设置
其他:
m.add_child(folium.LatLngPopup()) #显示鼠标点击点经纬度 m.add_child(folium.ClickForMarker(popup='Waypoint')) # 将鼠标点击点添加到地图上
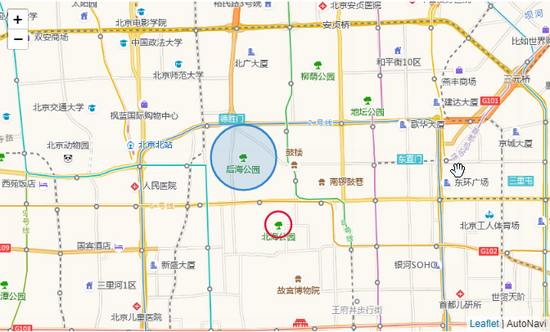
添加圆
folium.Circle( radius=300, location=[39.928614,116.391746], popup='北海公园', color='crimson', fill=False, ).add_to(m) folium.CircleMarker( location=[39.942143,116.382590], radius=50, popup='后海公园', color='#3186cc', fill=True, fill_color='#3186cc' ).add_to(m)
img
Circle和CircleMarker的不同:CircleMarker的radius一个单位是像素,Circle的一个单位时米
添加线段
folium.PolyLine([ [39.917834,116.397036], [39.928614,116.391746], [39.937282,116.403187], [39.942143,116.382590] ],color='red').add_to(m)
添加多边形
folium.Marker([39.917834,116.397036], popup='故宫').add_to(m) folium.Marker([39.928614,116.391746], popup='北海公园').add_to(m) folium.Marker([39.937282,116.403187], popup='南锣鼓巷').add_to(m) folium.Marker([39.942143,116.382590], popup='后海公园').add_to(m) folium.Polygon([ [39.917834,116.397036], [39.928614,116.391746], [39.942143,116.382590], [39.937282,116.403187], ],color='blue', weight=2, fill=True, fill_color='blue', fill_opacity=0.3).add_to(m)
Folium的其他高级应用
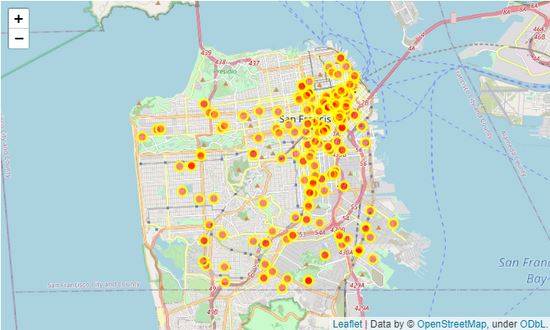
在地图上显示前200条犯罪数据
import folium import pandas as pd san_map = folium.Map(location=[37.77, -122.42], zoom_start=12,width='50%',height='50%') # cdata = pd.read_csv('https://cocl.us/sanfran_crime_dataset') cdata = pd.read_csv('Police_Department_Incidents_-_Previous_Year__2016_.csv') #犯罪数据,包含犯罪所在经纬度 # get the first 200 crimes in the cdata limit = 200 data = cdata.iloc[0:limit, :] # Instantiate a feature group for the incidents in the dataframe incidents = folium.map.FeatureGroup() # Loop through the 200 crimes and add each to the incidents feature group for lat, lng, in zip(cdata.Y, data.X): incidents.add_child( folium.CircleMarker( [lat, lng], radius=7, # define how big you want the circle markers to be color='yellow', fill=True, fill_color='red', fill_opacity=0.4 ) ) san_map.add_child(incidents)
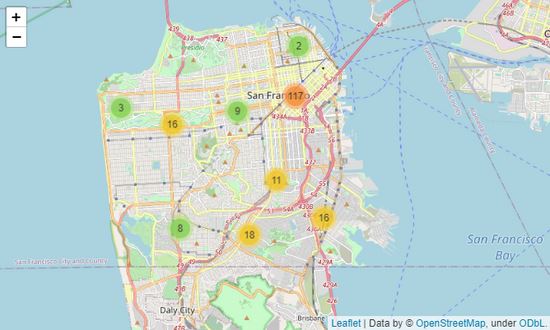
统计区域犯罪总数
from folium import plugins # let's start again with a clean copy of the map of San Francisco san_map = folium.Map(location=[37.77, -122.42], zoom_start=12,width='50%',height='50%') # instantiate a mark cluster object for the incidents in the dataframe incidents = plugins.MarkerCluster().add_to(san_map) # loop through the dataframe and add each data point to the mark cluster for lat, lng, label, in zip(data.Y, data.X, cdata.Category): folium.Marker( location=[lat, lng], icon=None, popup=label, ).add_to(incidents) # add incidents to map san_map.add_child(incidents)
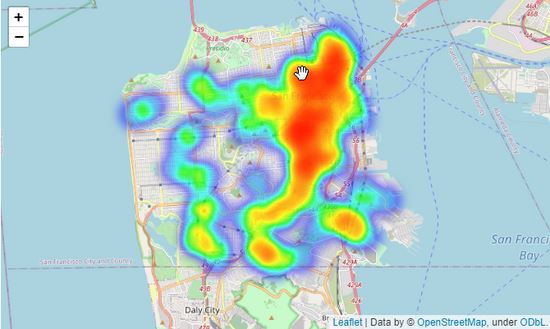
以热力图的方式呈现
from folium.plugins import HeatMap san_map = folium.Map(location=[37.77, -122.42], zoom_start=12,width='50%',height='50%') # Convert data format heatdata = data[['Y','X']].values.tolist() # add incidents to map HeatMap(heatdata).add_to(san_map) san_map
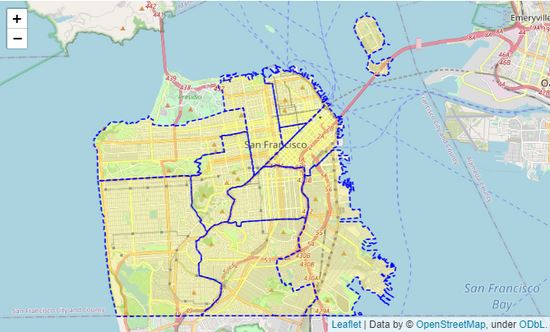
在地图上呈现GeoJSON边界数据
import json import requests # url = 'https://cocl.us/sanfran_geojson' url = 'san-francisco.geojson' san_geo = f'{url}' san_map = folium.Map(location=[37.77, -122.42], zoom_start=12,width='50%',height='50%') folium.GeoJson( san_geo, style_function=lambda feature: { 'fillColor': '#ffff00', 'color': 'blue', 'weight': 2, 'dashArray': '5, 5' } ).add_to(san_map) san_map
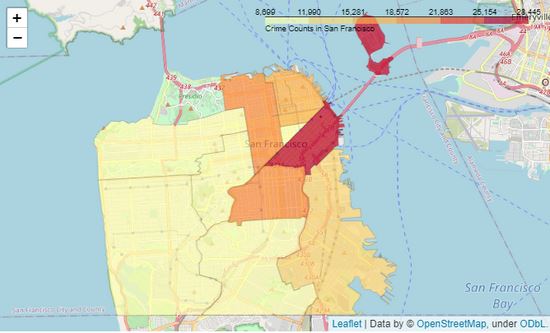
在GeoJSON上绘制Choropleth分级着色图
# Count crime numbers in each neighborhood disdata = pd.DataFrame(cdata['PdDistrict'].value_counts()) disdata.reset_index(inplace=True) disdata.rename(columns={'index':'Neighborhood','PdDistrict':'Count'},inplace=True) san_map = folium.Map(location=[37.77, -122.42], zoom_start=12,width='50%',height='50%') folium.Choropleth( geo_data=san_geo, data=disdata, columns=['Neighborhood','Count'], key_on='feature.properties.DISTRICT', #fill_color='red', fill_color='YlOrRd', fill_opacity=0.7, line_opacity=0.2, highlight=True, legend_name='Crime Counts in San Francisco' ).add_to(san_map) san_map
3. 各地图提供商瓦片服务地图规则 高德地图
目前高德的瓦片地址有如下两种:
http://wprd0{1-4}.is.autonavi.com/appmaptile?x={x}&y={y}&z={z}&lang=zh_cn&size=1&scl=1&style=7<ype=1
http://webst0{1-4}.is.autonavi.com/appmaptile?style=7&x={x}&y={y}&z={z}
前者是高德的新版地址,后者是老版地址。
高德新版的参数:
lang:可以通过zh_cn设置中文,en设置英文
size:基本无作用
scl:瓦片尺寸控制,1=256,2=512
style:设置影像和路网,style=6为卫星图,style=7为街道图,style=8为标注图
ltype:线性控制,增加后,只对地图要素进行控制,没有文字注记,要素多少,是否透明
这些规律并不是绝对的,有可能有的组合某些参数不起作用。
谷歌地图
目前谷歌的瓦片地址也存在两种:
http://mt{0-3}.google.cn/vt/lyrs=m&hl=zh-CN&gl=cn&x={x}&y={y}&z={z}
http://mt{0-3}.google.com/vt/lyrs=m&hl=zh-CN&gl=cn&x={x}&y={y}&z={z}
参数详解:
lyrs = 类型
h = roads only 仅限道路
m = standard roadmap 标准路线图
p = terrain 带标签的地形图
r = somehow altered roadmap 某种改变的路线图
s = satellite only 仅限卫星
t = terrain only 仅限地形
y = hybrid 带标签的卫星图
gl = 坐标系
CN = 中国火星坐标系
hl = 地图文字语言
zh-CN = 中文
en-US = 英文
x = 瓦片横坐标
y = 瓦片纵坐标
z = 缩放级别 卫星图0-14,路线图0-17
百度地图
百度当前的瓦片地址:
http://online{0-4}.map.bdimg.com/onlinelabel/?qt=tile&x={x}&y={y}&z={z}&styles=pl&udt=202004151&scaler=2&p=0
http://api{0-3}.map.bdimg.com/customimage/tile?&x={x}&y={y}&z={z}&udt=20180601&scale=1
http://its.map.baidu.com:8002/traffic/TrafficTileService?level={z}&x={x}&y={y}&time=1373790856265&label=web2D&;v=017
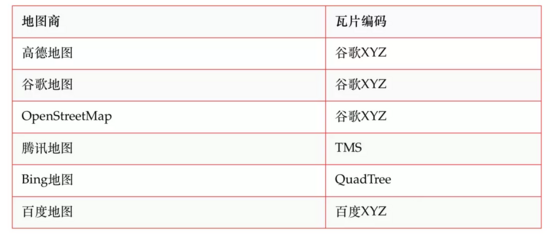
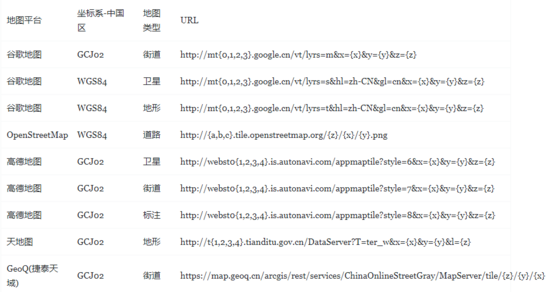
备注:瓦片地址中的x和y对应的并不是经纬度值,而是瓦片编号,中国主要地图商的瓦片编号流派:
目前百度的瓦片编号比较特殊,Folium暂不支持。
其他参考资料:
https://github.com/geometalab/pyGeoTile
https://github.com/anzhihun/OpenLayers3Primer/blob/master/ch05/05-03.md
http://www.winseliu.com/blog/2018/01/30/map-started-guide/
https://github.com/CntChen/tile-lnglat-transform
腾讯地图
腾讯地图的瓦片地图URL格式:
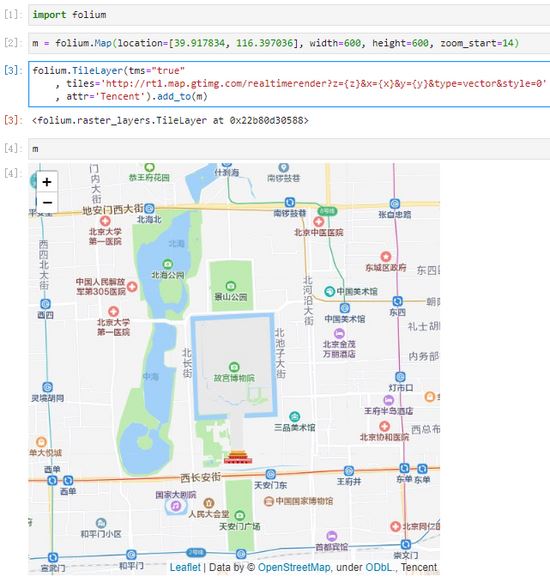
http://rt1.map.gtimg.com/realtimerender?z={z}&x={x}&y={y}&type=vector&style=0
由于腾讯地图使用的瓦片编码时TMS,所以使用时需要额外的设置。具体如下:
其他底图
{0,1,2,3}代表了url的subDomain,在请求时会随机的在url中使用mt0、mt1、mt2、mt3。{z}代表zoom,即缩放级别,{x}代表列号,{y}代表行号。
GeoQ 官网有公开的多个基于 ArcGIS 的地图服务,均可使用,详见
https://map.geoq.cn/arcgis/rest/services
jsjbwy