当前位置 博文首页 > 大家一起学编程(python):matplotlib-bilibili,抖音很火的动态

    大家一起学编程(python):matplotlib-bilibili,抖音很火的动态

    作者:[db:作者] 时间:2021-06-19 12:35

    ?matplotlib-bilibili,抖音很火的动态数据视频自动生成(第四节)-视频,语音自动合成

    还记得上一节中我们所提到的数据动态视频吗??这次,为了让大家更加方便的制作自动生成视频,我们可在excel中自由配置数据,方便大家操作?,并且还增加了视频和语音自动合成的方式?。

    ?

    01— 优化操作

    ?

    第一步?:导入xlrd模块,并定义excel模板

    如上就是我们需要的模板?。

    接下来我们来处理数据。

    ?

    第二步?:处理excel,返回相同时间的数据?。

    import operator
    import xlrd
    ?
    f=xlrd.open_workbook("数据.xls")# 打开excel文件读取数据
    sheet=f.sheet_by_index(0)
    ?
    def?sort_sheet(hour,name='数量'):
        list=[]
        ncols=sheet.ncols
        for i in range(1,sheet.nrows):
            if str(int(sheet.row_values(i)[1]))==str(hour):
                dict = {}
                for j in range(ncols):
                    dict[sheet.cell_value(0,j)]=sheet.row_values(i)[j]
                list.append(dict)
        return sorted(list,key=operator.itemgetter(name))#升序排列
        # return sorted(list, key=operator.itemgetter(name),reverse=True)  # 降序排列

    第三步?:定义颜色

    color={"x":"#adb0ff","y":"#ffb3ff","z":"#90d595","a":"#FDF5E6"}

    第四步?:建立图表

    from matplotlib import animation
    from matplotlib import pyplot
    from pylab import mpl
    ?
    mpl.rcParams['font.sans-serif'] =["SimHei"]
    mpl.rcParams['axes.unicode_minus'] = False
    fig, ax = pyplot.subplots()#返回一个包含figure和axes对象的元组,将元组分解为fig和ax两个变量
    ?
    def  graph(num):
        ax.clear()#清除,不叠加
    ????list=sort_sheet(num)#调用上面定义的函数
        for i,chart_barh in enumerate(list):
            ax.barh(i,chart_barh["数量"],color=color[chart_barh["颜色"]])#?绘制水平方向的条形图barh()
            ax.text(chart_barh["数量"],i,chart_barh["名称"],size=14,weight=600,ha='left',va='bottom')#添加文字并设置样式
        ax.text(350, 2, num, size=20, weight=600, ha='left', va='bottom')
        ax.xaxis.set_ticks_position('top')
        ax.set_axisbelow(True)
        pyplot.xlim(0,300)
        pyplot.title('不同用户的文章点赞情况')#添加图标题
    ?
    animator=animation.FuncAnimation(fig, graph, frames=range(1,24))
    pyplot.show()#移动到函数外面,不然不会动态显示

    制作结果?:如图

    第五步?:视频,音频合成,这里需要引入?os模块。

    cmd = "ffmpeg -i %s -i %s %s" % (self.mp3, self.mp4, self.new_mp4)os.system(cmd)

    注意:需要安装ffmpeg程序

    windows如何安装ffmpeg

    02— 完整代码

    import os
    from matplotlib import animation
    from matplotlib import pyplot
    from pylab import mpl
    import operator
    import xlrd
    ?
    class chart(object):
        def __init__(self):
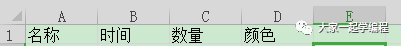
            f = xlrd.open_workbook("数据.xls")  # 打开excel文件读取数据
            self.sheet = f.sheet_by_index(0)
            self.color = {"x": "#adb0ff", "y": "#ffb3ff", "z": "#90d595", "a": "#FDF5E6"}
            mpl.rcParams['font.sans-serif'] = ["SimHei"]
            mpl.rcParams['axes.unicode_minus'] = False
            self.fig, self.ax = pyplot.subplots()  # 返回一个包含figure和axes对象的元组,将元组分解为fig和ax两个变量
            self.mp4 = 'E:\\数据动态展示.mp4'#生成视频名称,绝对路径
            self.mp3 = 'E:\\5018.mp3'#音频路径
            self.new_mp4 = 'E:\\new合成.mp4'#合成的mp4路径
        def sort_sheet(self,num,name='数量'):
            list=[]
            ncols=self.sheet.ncols
            for i in range(1,self.sheet.nrows):
                if str(int(self.sheet.row_values(i)[1]))==str(num):
                    dict = {}
                    for j in range(ncols):
                        dict[self.sheet.cell_value(0,j)]=self.sheet.row_values(i)[j]
                    list.append(dict)
            return sorted(list,key=operator.itemgetter('数量'))#升序排列
            # return sorted(list, key=operator.itemgetter(name),reverse=True)  # 降序排列
        def  graph(self,num):
            self.ax.clear()#清除,不叠加
            list=self.sort_sheet(num)
            for i,chart_barh in enumerate(list):
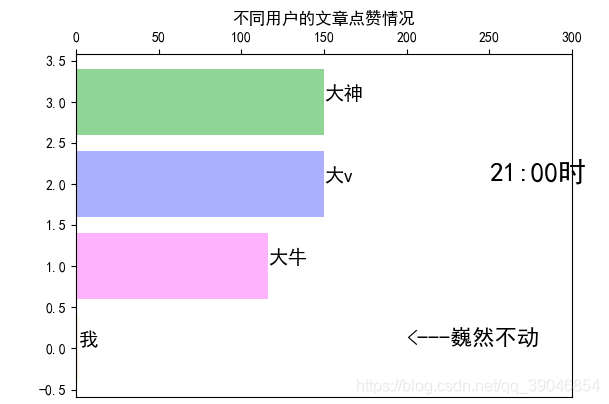
                self.ax.barh(i,chart_barh["数量"],color=self.color[chart_barh["颜色"]])#?绘制水平方向的条形图barh()
                self.ax.text(chart_barh["数量"],i,chart_barh["名称"],size=14,weight=600,ha='left',va='bottom')#添加文字并设置样式
            self.ax.text(250, 2, str(num)+":00时", size=20, weight=600, ha='left', va='bottom')
            self.ax.text(200,0, "<---巍然不动", size=16, weight=600, ha='left', va='bottom')
            self.ax.xaxis.set_ticks_position('top')
            self.ax.set_axisbelow(True)
            pyplot.xlim(0,300)
            pyplot.title('不同用户的文章点赞情况')#添加图标题
        def mp4_and_mp3(self):
            animator = animation.FuncAnimation(self.fig, self.graph, frames=range(1, 24))
            animator.save(self.mp4)
            pyplot.show()
            cmd = "ffmpeg -i %s -i %s %s" % (self.mp3, self.mp4, self.new_mp4)
            os.system(cmd)
    if __name__ == '__main__':
        chart=chart()
        chart.mp4_and_mp3()

    相关推荐(个人主页也有哦,赶快收藏起来)?:

    动态数据视频(第一节)

    bilibili,抖音很火的动态数据视频自动生成(第二节)

    matplotlib-bilibili,抖音很火的动态数据视频自动生成(第三节)

    matplotlib给女朋友画一个爱心吧,这份满满的爱意,一定要记得收下

    欢迎关注我们

    ?

    ?

    大家一起学编程

    以学习为主,兴趣为辅,致力于开发,发现更多好玩有趣的编程技巧以及好玩有趣的编程思路。为喜欢编程和想要学习编程的人找到编程的乐趣和动力。

    ?