最近项目中需要对mesh做一个色彩映射,无意间发现vtk的封装库pyvista相当好用,就试了试,在此做一个总结。
PyVista简介
PyVista是什么
PyVista 是一个:
- VTK for humans”, 可视化工具包(VTK)的高级API
- 空间数据的网格数据结构与滤波方法
- 使3D绘图更加简单,可用于大型/复杂数据的图像化
PyVista(以前的vtki)是可视化工具包(VTK)的一个助手模块,它采用了一种不同的方法,通过NumPy和直接数组访问与VTK进行接口。这个包提供了一个python化的、文档化良好的接口,展示了VTK强大的可视化后端,以方便对空间引用的数据集进行快速原型化、分析和可视化集成。
该模块可用于演示文稿和研究论文的科学绘图,以及其他依赖网格的Python模块的支持模块。
参考:https://docs.pyvista.org/index.html
github
官方教程
pyvista和其他3D可视化工具比较
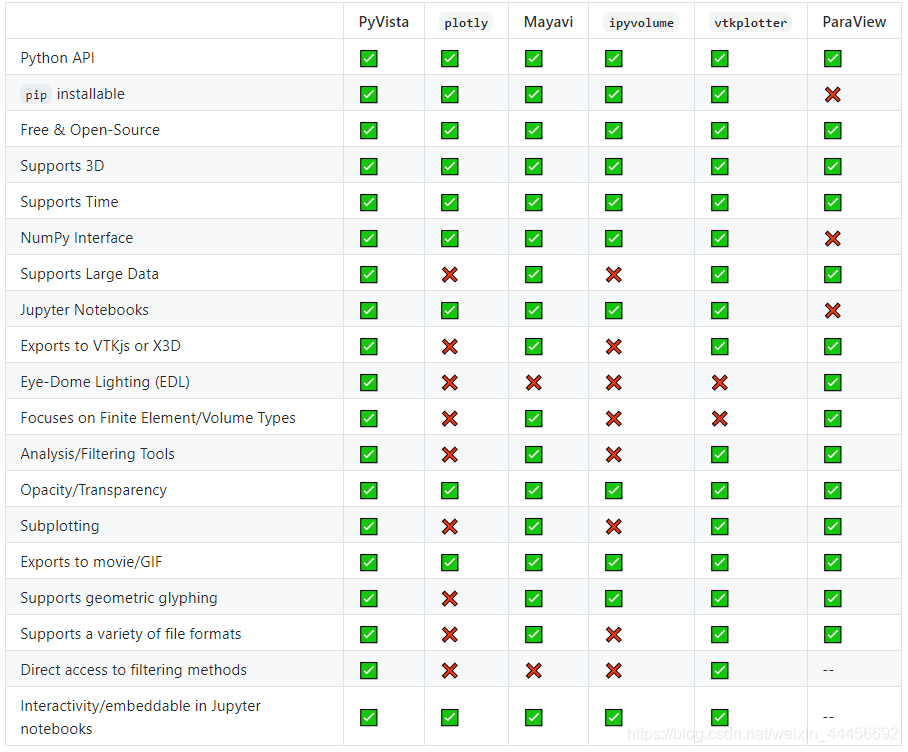
参考:https://github.com/pyvista/pyvista/issues/146
pyvista使用
安装
pip install pyvista -i https://pypi.tuna.tsinghua.edu.cn/simple
I/O读取及可视化
mesh类型
pyvista支持读取大多数常见的mesh文件类型,比如PLY,VTK,STL ,OBJ ,BYU 等,一些不常见的mesh文件类型,比如FEniCS/Dolfin_ XML format
(很遗憾,pyvista不支持点云PCD格式,不过可以通过pcdpy、pclpy、python-pcl等库来读取pcd文件)
import pyvista as pv
# 读取
mesh = pv.read('pointCloudData/data.vtk')
# 显示
mesh.plot()
# 其他类似
mesh = pv.read('pointCloudData/data.ply')
……
图片类型
支持读取图片类型数据JPEG, TIFF, PNG等
# 读取
image = pv.read('my_image.jpg')
# 显示
image.plot(rgb=True, cpos="xy")

# 其余图片类型类似
……
mesh彩色映射
项目中需要用到根据高度来对mesh进行彩色映射,在pyvista中大概有四种方法
自定义
代码
import pyvista as pv
import matplotlib.pyplot as plt
from matplotlib.colors import ListedColormap
import numpy as np

def mesh_cmp_custom(mesh, name):
 """
 自定义色彩映射
 :param mesh: 输入mesh
 :param name: 比较数据的名字
 :return:
 """
 pts = mesh.points
 mesh[name] = pts[:, 1]
 # Define the colors we want to use
 blue = np.array([12 / 256, 238 / 256, 246 / 256, 1])
 black = np.array([11 / 256, 11 / 256, 11 / 256, 1])
 grey = np.array([189 / 256, 189 / 256, 189 / 256, 1])
 yellow = np.array([255 / 256, 247 / 256, 0 / 256, 1])
 red = np.array([1, 0, 0, 1])

 c_min = mesh[name].min()
 c_max = mesh[name].max()
 c_scale = c_max - c_min

 mapping = np.linspace(c_min, c_max, 256)
 newcolors = np.empty((256, 4))
 newcolors[mapping >= (c_scale * 0.8 + c_min)] = red
 newcolors[mapping < (c_scale * 0.8 + c_min)] = grey
 newcolors[mapping < (c_scale * 0.55 + c_min)] = yellow
 newcolors[mapping < (c_scale * 0.3 + c_min)] = blue
 newcolors[mapping < (c_scale * 0.1 + c_min)] = black

 # Make the colormap from the listed colors
 my_colormap = ListedColormap(newcolors)
 mesh.plot(scalars=name, cmap=my_colormap)

if __name__ == '__main__':
 mesh = pv.read('pointCloudData/1.ply')
 mesh_cmp_custom(mesh, 'y_height')
效果:

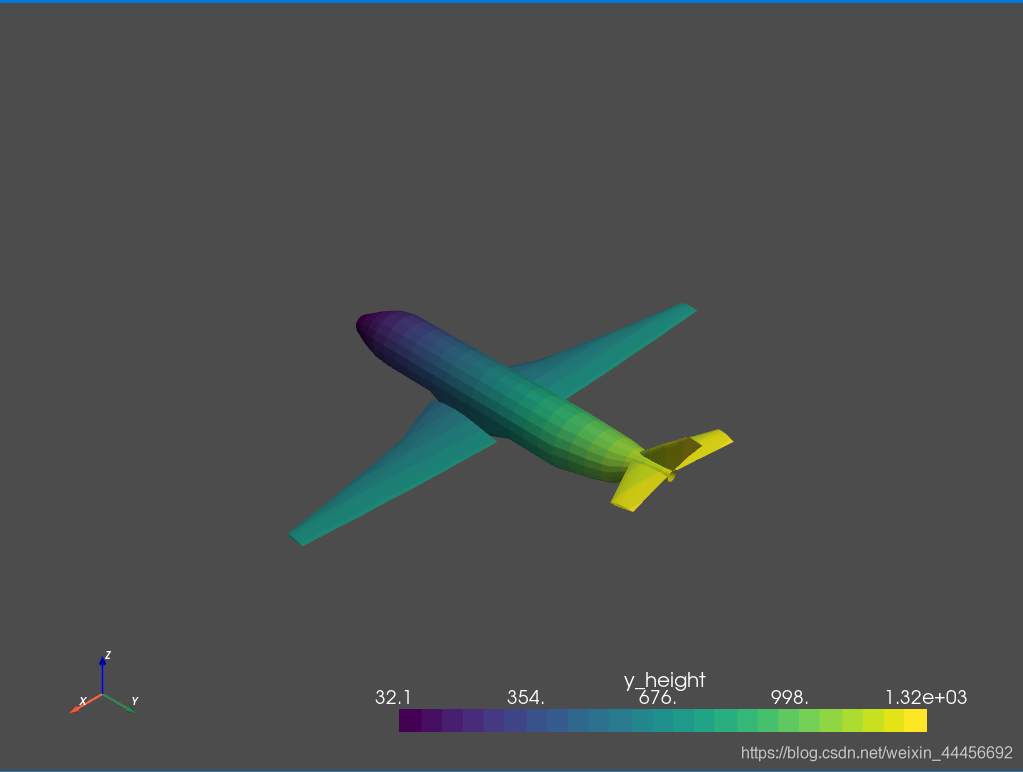
使用pyvista自带的cmp
函数mesh.plot(scalars=name, cmap='viridis_r')
其中cmap支持的样式:
‘Accent', ‘Accent_r', ‘Blues', ‘Blues_r', ‘BrBG', ‘BrBG_r', ‘BuGn', ‘BuGn_r', ‘BuPu', ‘BuPu_r', ‘CMRmap', ‘CMRmap_r', ‘Dark2', ‘Dark2_r', ‘GnBu', ‘GnBu_r', ‘Greens', ‘Greens_r', ‘Greys', ‘Greys_r', ‘OrRd', ‘OrRd_r', ‘Oranges', ‘Oranges_r', ‘PRGn', ‘PRGn_r', ‘Paired', ‘Paired_r', ‘Pastel1', ‘Pastel1_r', ‘Pastel2', ‘Pastel2_r', ‘PiYG', ‘PiYG_r', ‘PuBu', ‘PuBuGn', ‘PuBuGn_r', ‘PuBu_r', ‘PuOr', ‘PuOr_r', ‘PuRd', ‘PuRd_r', ‘Purples', ‘Purples_r', ‘RdBu', ‘RdBu_r', ‘RdGy', ‘RdGy_r', ‘RdPu', ‘RdPu_r', ‘RdYlBu', ‘RdYlBu_r', ‘RdYlGn', ‘RdYlGn_r', ‘Reds', ‘Reds_r', ‘Set1', ‘Set1_r', ‘Set2', ‘Set2_r', ‘Set3', ‘Set3_r', ‘Spectral', ‘Spectral_r', ‘Wistia', ‘Wistia_r', ‘YlGn', ‘YlGnBu', ‘YlGnBu_r', ‘YlGn_r', ‘YlOrBr', ‘YlOrBr_r', ‘YlOrRd', ‘YlOrRd_r', ‘afmhot', ‘afmhot_r', ‘autumn', ‘autumn_r', ‘binary', ‘binary_r', ‘bone', ‘bone_r', ‘brg', ‘brg_r', ‘bwr', ‘bwr_r', ‘cividis', ‘cividis_r', ‘cool', ‘cool_r', ‘coolwarm', ‘coolwarm_r', ‘copper', ‘copper_r', ‘cubehelix', ‘cubehelix_r', ‘flag', ‘flag_r', ‘gist_earth', ‘gist_earth_r', ‘gist_gray', ‘gist_gray_r', ‘gist_heat', ‘gist_heat_r', ‘gist_ncar', ‘gist_ncar_r', ‘gist_rainbow', ‘gist_rainbow_r', ‘gist_stern', ‘gist_stern_r', ‘gist_yarg', ‘gist_yarg_r', ‘gnuplot', ‘gnuplot2', ‘gnuplot2_r', ‘gnuplot_r', ‘gray', ‘gray_r', ‘hot', ‘hot_r', ‘hsv', ‘hsv_r', ‘inferno', ‘inferno_r', ‘jet', ‘jet_r', ‘magma', ‘magma_r', ‘nipy_spectral', ‘nipy_spectral_r', ‘ocean', ‘ocean_r', ‘pink', ‘pink_r', ‘plasma', ‘plasma_r', ‘prism', ‘prism_r', ‘rainbow', ‘rainbow_r', ‘seismic', ‘seismic_r', ‘spring', ‘spring_r', ‘summer', ‘summer_r', ‘tab10', ‘tab10_r', ‘tab20', ‘tab20_r', ‘tab20b', ‘tab20b_r', ‘tab20c', ‘tab20c_r', ‘terrain', ‘terrain_r', ‘turbo', ‘turbo_r', ‘twilight', ‘twilight_r', ‘twilight_shifted', ‘twilight_shifted_r', ‘viridis', ‘viridis_r', ‘winter', ‘winter_r'
代码
import pyvista as pv
def mesh_cmp(mesh, name):
 """
  使用进行plot自带的色彩映射
  :param mesh: 输入mesh
  :param name: 比较数据的名字
  :return:
 """
 pts = mesh.points
 mesh[name] = pts[:, 1]
 mesh.plot(scalars=name, cmap='viridis_r')

if __name__ == '__main__':
 mesh = pv.read('vtkData/airplane.ply')
 mesh_cmp(mesh, 'y_height')
效果
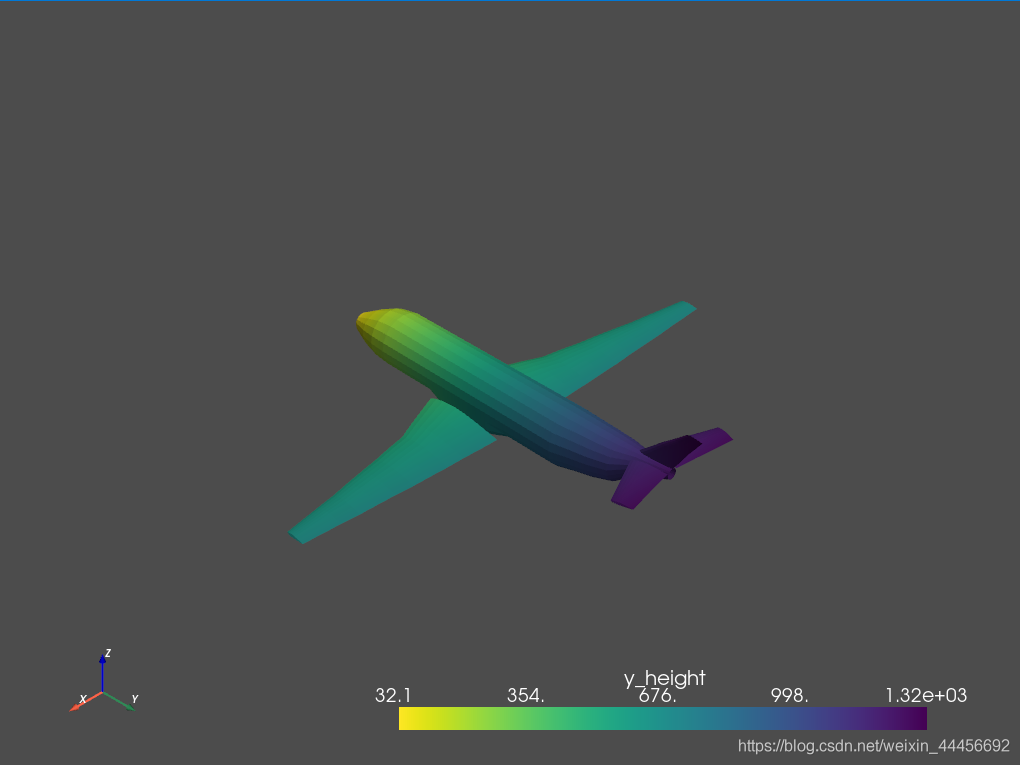
使用Matplotlib的cmp
代码
import pyvista as pv
import matplotlib.pyplot as plt

def mesh_cmp_mpl(mesh, name):
 """
  使用Matplotlib进行色彩映射
  :param mesh: 输入mesh
  :param name: 比较数据的名字
  :return:
  """
 pts = mesh.points
 mesh[name] = pts[:, 1]
 mlp_cmap = plt.cm.get_cmap("viridis", 25)
 mesh.plot(scalars=name, cmap=mlp_cmap)

if __name__ == '__main__':
 mesh = pv.read('vtkData/airplane.ply')
 mesh_cmp_mpl(mesh, 'y_height')
效果
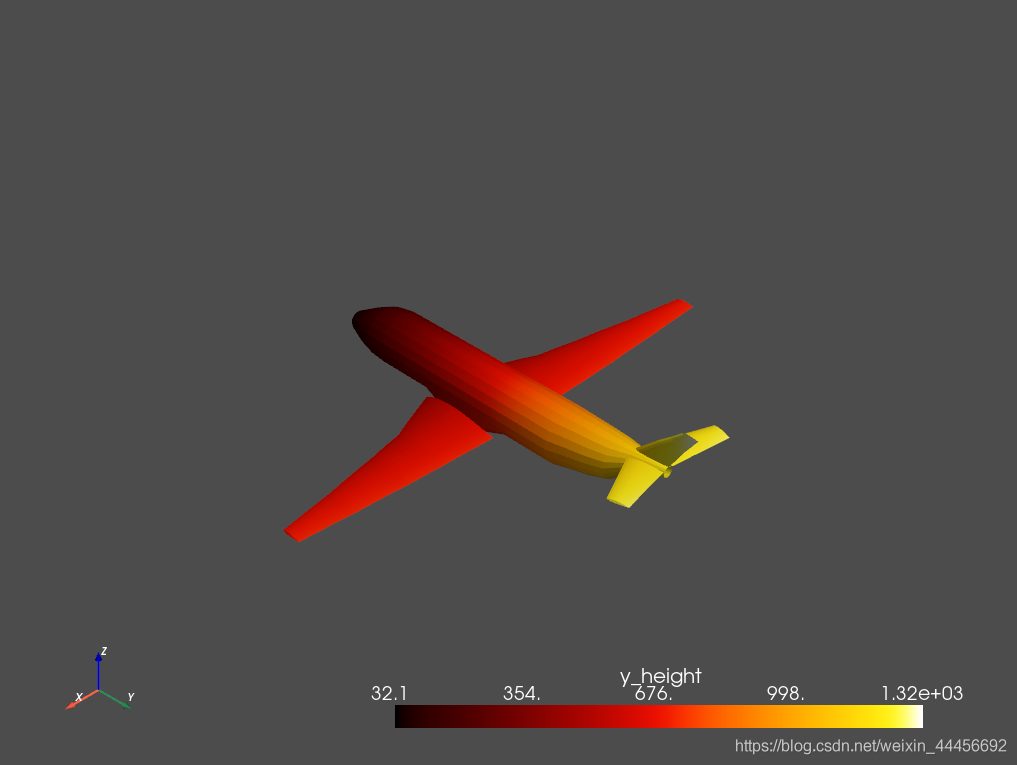
使用colorcet的cmp
需要先安装colorcet:
使用方法和上面几种方法类似,若想使用colorcet的colormaps中的hot:
mesh.plot(scalars=name, cmap=“hot”)
代码
def mesh_cmp_colorcet(mesh, name):
 """
  使用进行colorcet进行色彩映射
  :param mesh: 输入mesh
  :param name: 比较数据的名字
  :return:
 """
 pts = mesh.points
 mesh[name] = pts[:, 1]
 mesh.plot(scalars=name, cmap=colorcet.fire)

if __name__ == '__main__':
 mesh = pv.read('vtkData/airplane.ply')
 mesh_cmp_colorcet(mesh, 'y_height')
效果:
总结
pyvista相当强大,而且比直接用vtk更加方便(代码量肉眼可见的降低!)
js