Python�Ļ�ͼ��Ҳ�����û��������ŵ�ͼ�Σ����¸���ҽ��ܵ��ǹ���ggplot���ƻ�ͼ�ļ��ɣ�ggplot2������gridϵͳ�ϣ����ϵͳ��֧����������Ҫ���ⴴ��һ�����ݣ��ٻ�����Щ���ݹ���һ��geom_pathͼ�㣬������ͼ�ϲſ��Խ��и��ֻ��ƣ�����������ϸ��������ôʹ��ggplot��ͼ��
��飺
ggplot������plotnine�еģ��ܹ�����һ��ͼ�Ρ�
��װ��
pip install pandas plotnine
csv�ļ����ص�survs_df�����ݿ�ܣ�
ggplot(survs_df, aes(x='weight', y='hindfoot_length',
size = 'year')) + geom_point()
����ͼ�β��裺
1���������ݿ�
2����Ҫ�����ݿ��ת����λ�á���ɫ����С��
3����ʾʵ��ͼ��Ԫ��
ʵ�����룺
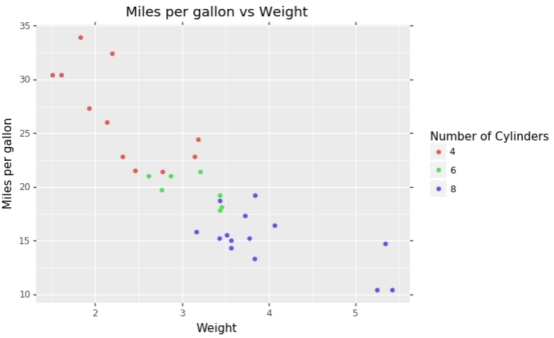
(ggplot(mtcars, aes(��wt', ��mpg', color='factor(cyl)'))
+ geom_point()
+ labs(title='Miles per gallon vs Weight', x='Weight', y='Miles per gallon')
+ guides(color=guide_legend(title='Number of Cylinders')) )
�������
֪ʶ����չ��
����ɢ��ͼ��geom_point()
��ȡ�ⲿ���ݽ��л�ͼ
>>> import pandas as pd
>>> from ggplot import *
>>> df=pd.read_table('C:\Users\lenovo\Desktop\mtcars.txt')
>>> df
����name type number volume size other
0 td T 96 3 20 c
1 sf F 87 5 65 c
2 cc F 79 9 80 d
�����ȡ������û��column��������
df.columns=['name','type','number','volume','size','other']
>>> p=ggplot(df, aes(x='number', y='volume', size='factor(size)', color='factor(other)'))+geom_point()
>>> print p
js